Writing a Profiler in 240 Lines of Pure Java
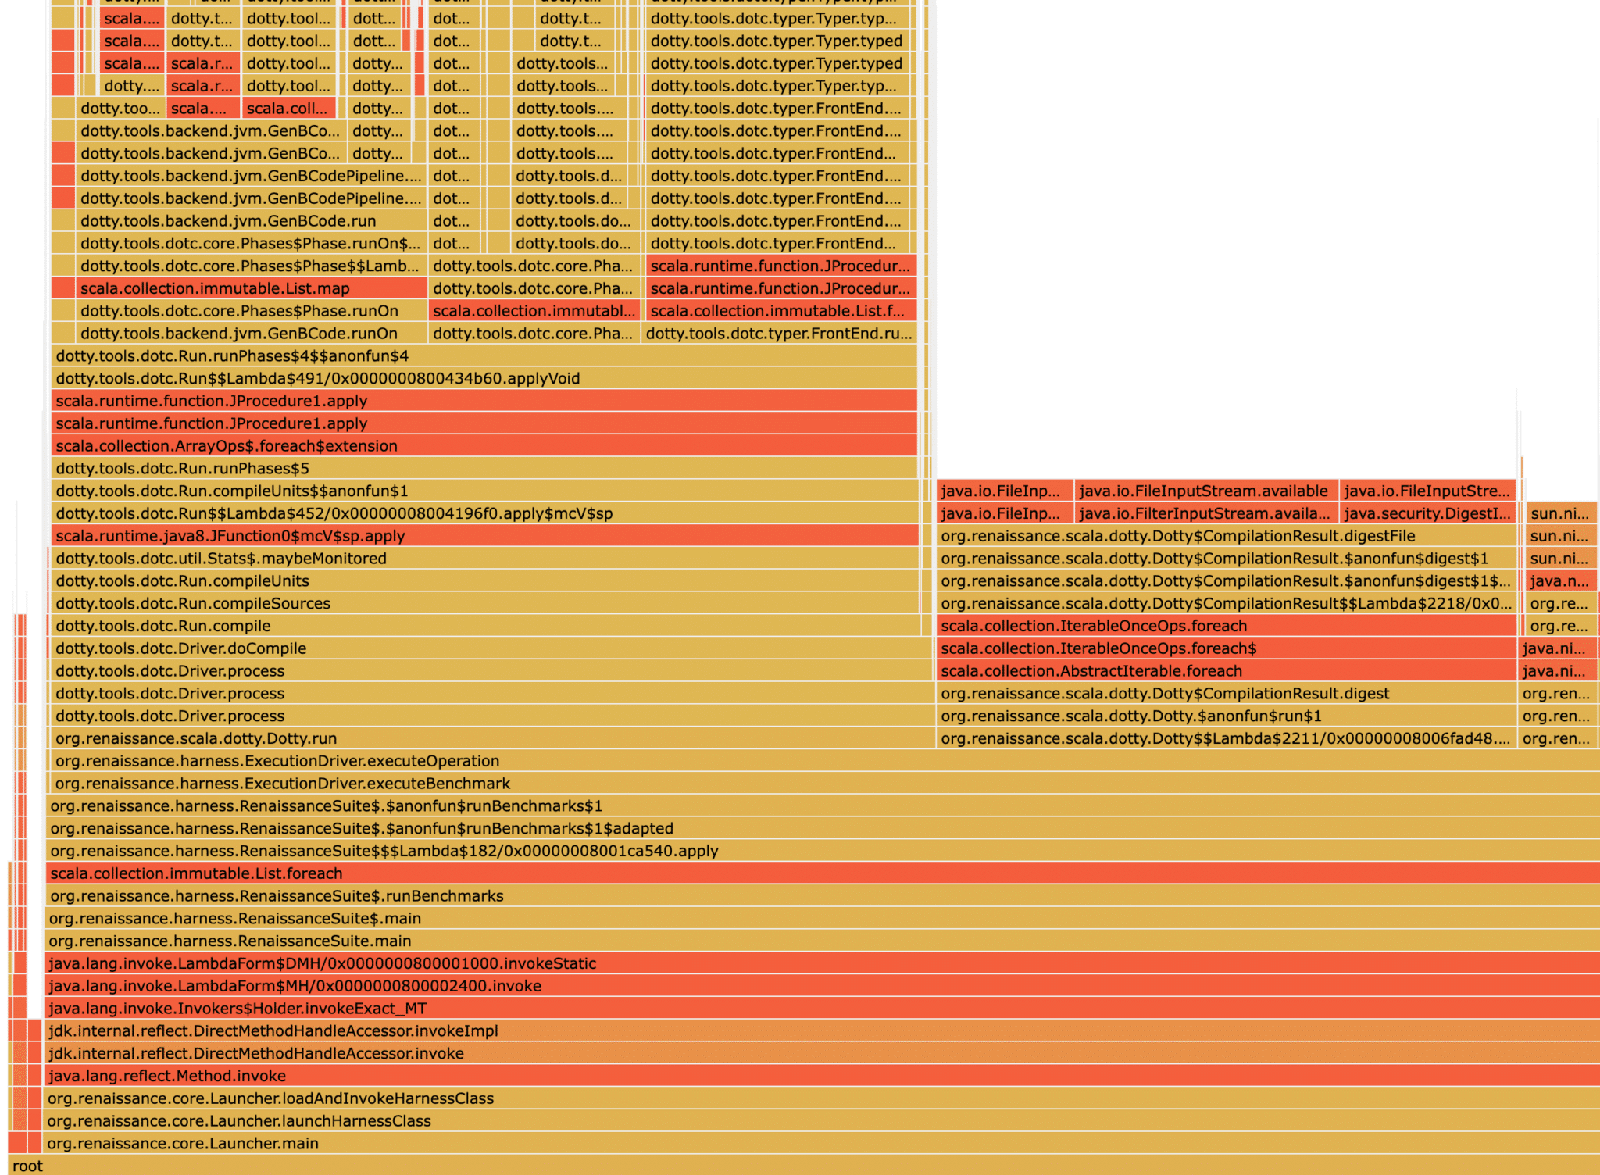
How to develop a tiny Java profiler, that can output flame graphs, in just 240 lines of pure Java, making it easy for anyone to understand.

How to develop a tiny Java profiler, that can output flame graphs, in just 240 lines of pure Java, making it easy for anyone to understand.

 14,078 views
Ever wondered why you need design patterns and how to apply them? Miroslav Wengner's book has you covered.
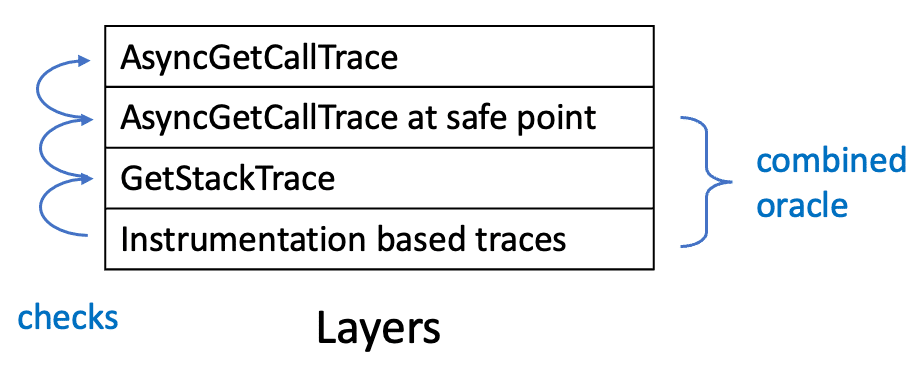
AsyncGetCallTrace is the base of many profilers, but how can we test it automatically to make sure it's correct? I'll explore a layered …
Do you trust profilers? I once did too. Here I describe why you should take the results of profilers with a grain of salt.

 6,276 views
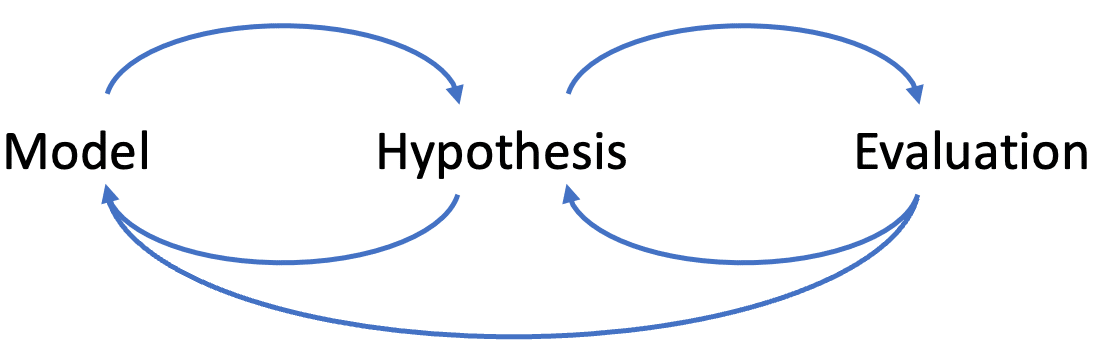
Let's talk about debugging and observability. We work with debugging all the time, but how well do we know this common practice?
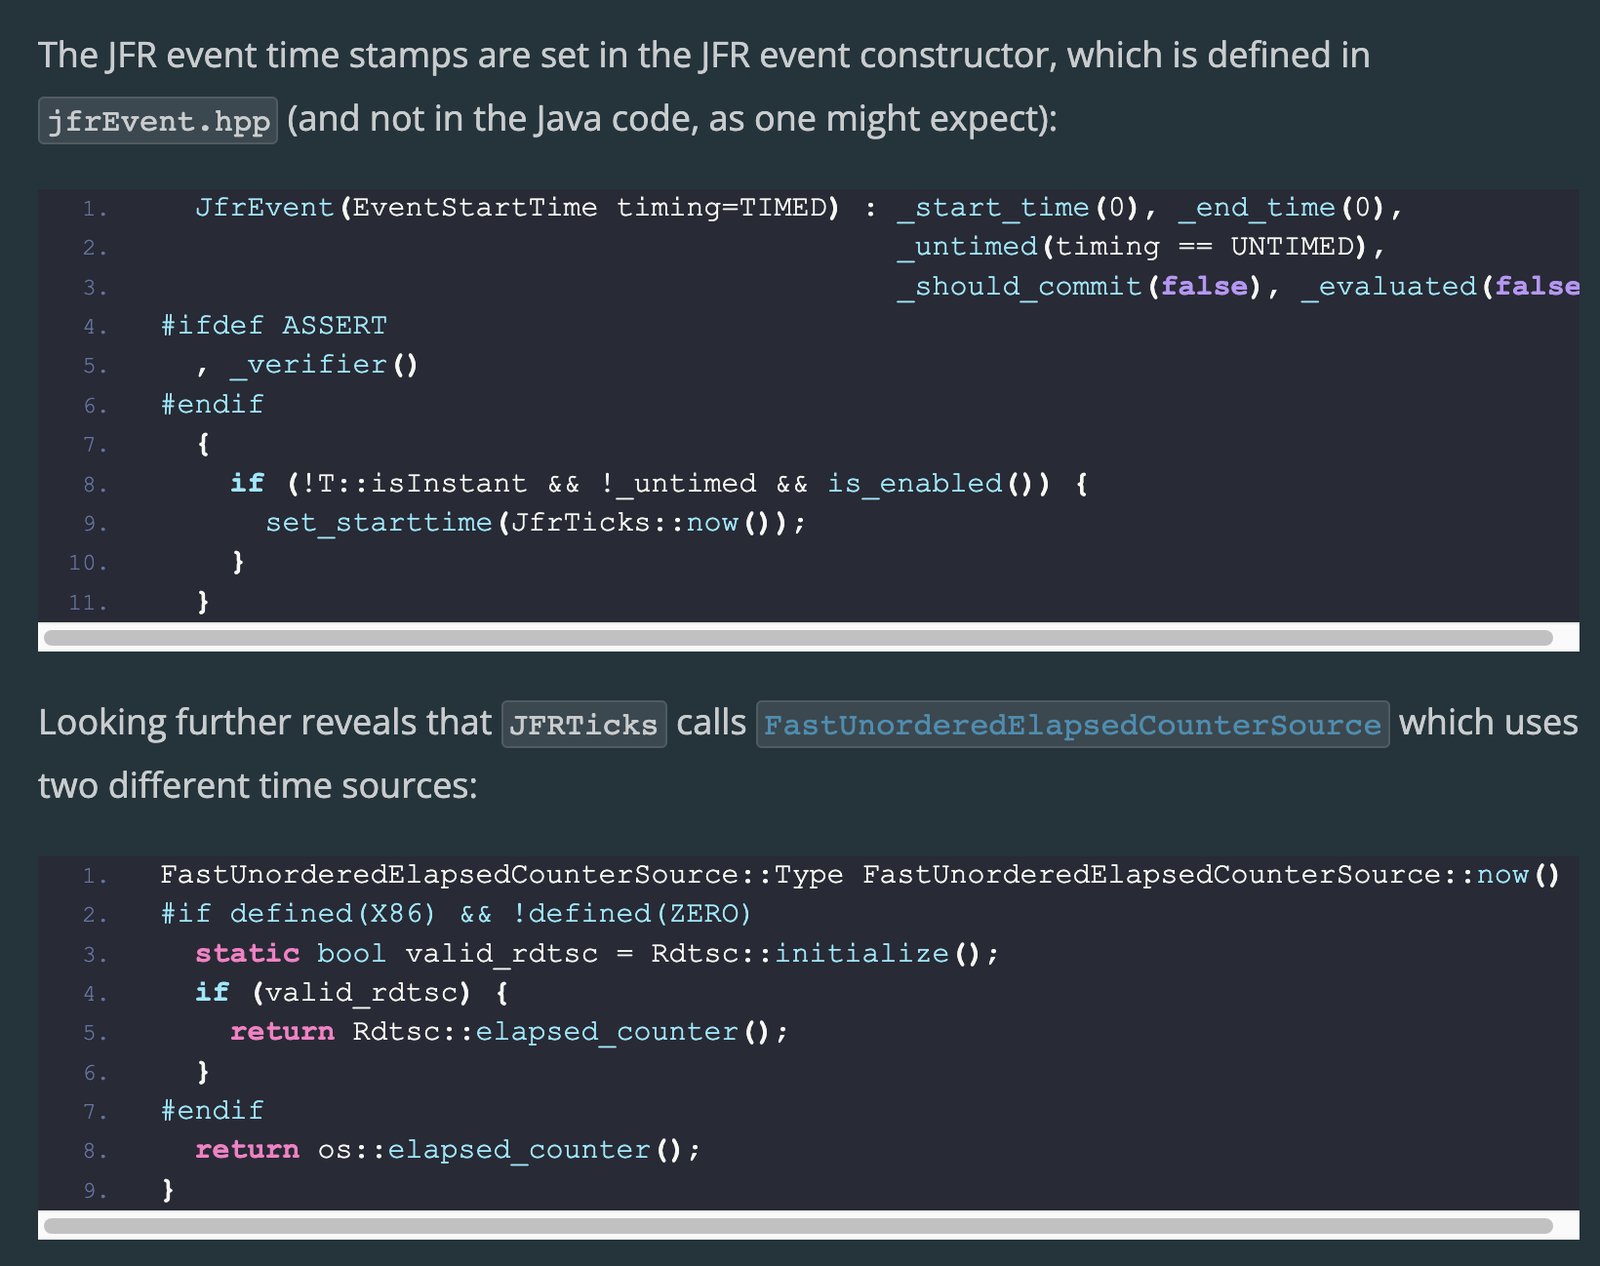
Did you ever wonder whether JFR timestamps use the same time source as System.nanoTime? Come down the rabbit hole with me!
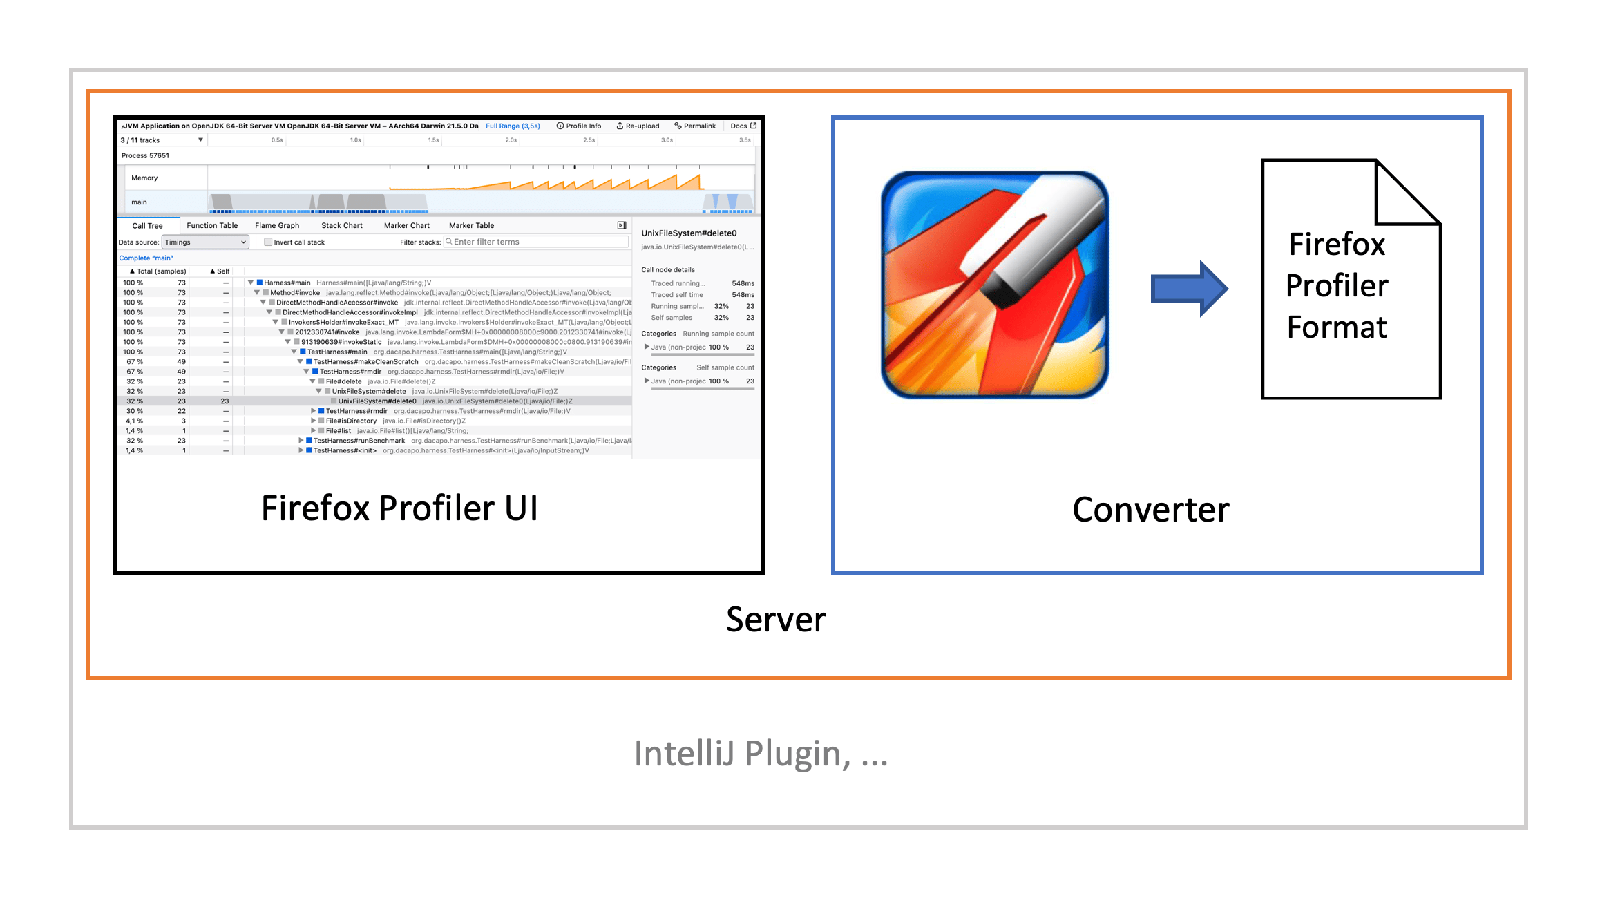
Ever wondered how to use Firefox Profiler to view your own profiling data? This article gives you the foundations!
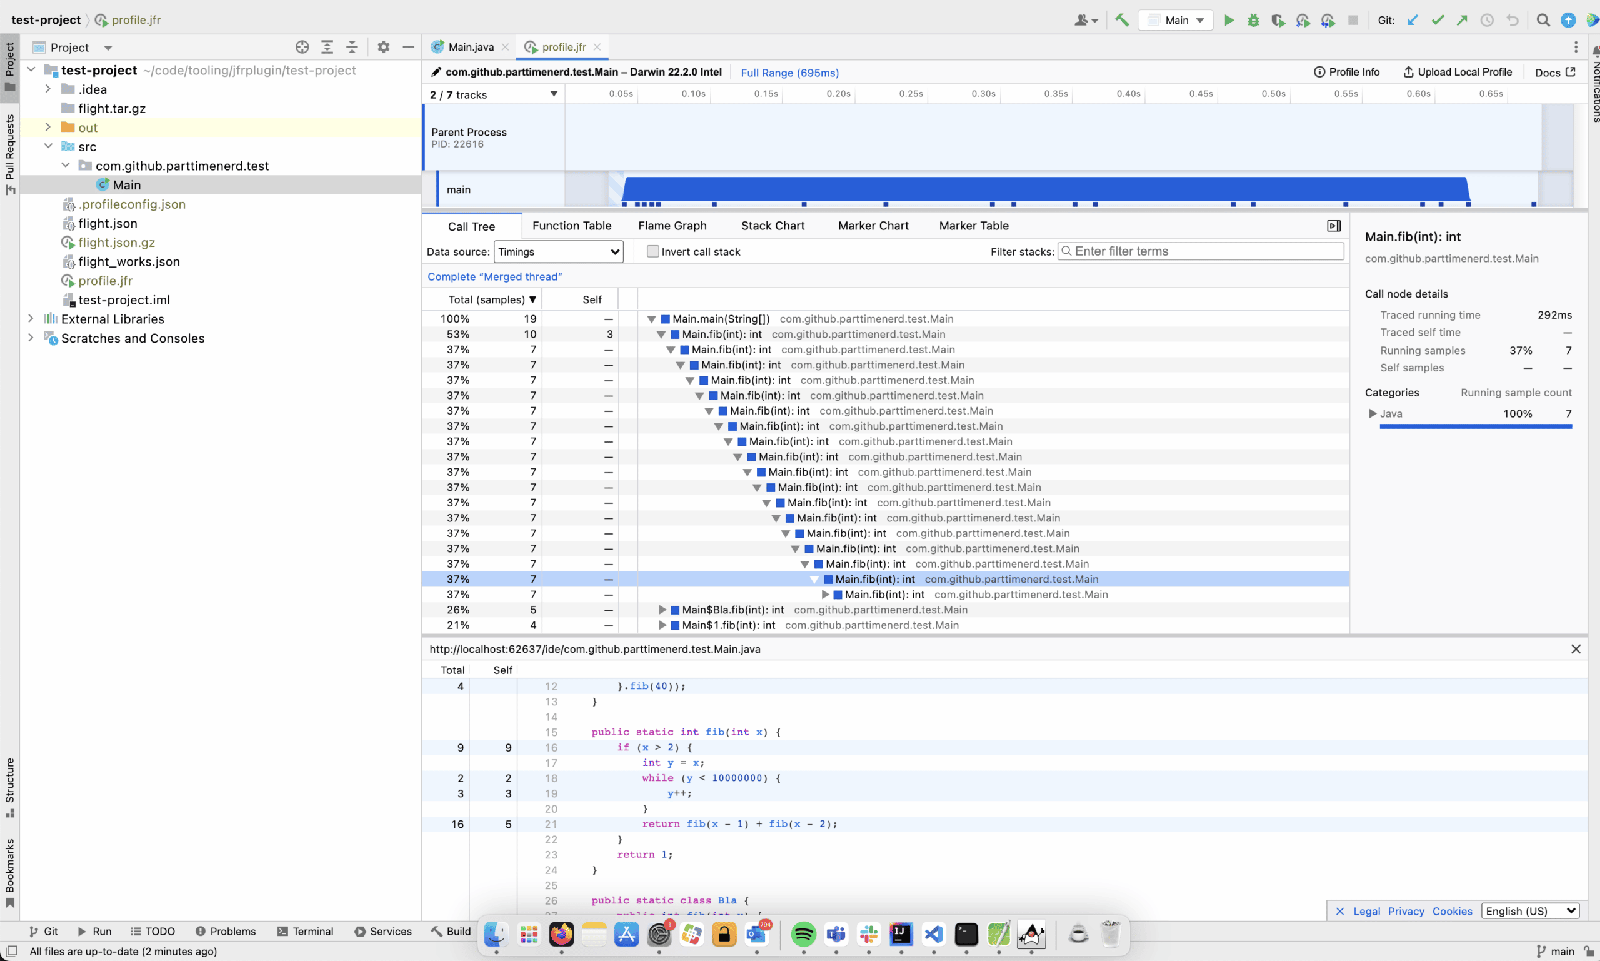
Ever wanted to profile your application directly from your IDE? Here comes the Java JFR Profiler plugin, an open-source plugin for IntelliJ!
An introduction into GetStackTrace, AsyncGetCallTrace, and the history and specification of AsyncGetStackTrace.
How do profilers like async-profiler work? How to write your own? This is the second part, covering wall-clock profiling.