

A Beginner's Guide to IntelliJ Profiler
Learn how to troubleshoot and optimize Java code with IntelliJ Profiler – using createDirectories() as an example.
Learn how to troubleshoot and optimize Java code with IntelliJ Profiler – using createDirectories() as an example.
What do you know about the code changes that were just introduced into the codebase? When will you notice if something goes wrong?
The School of OpenJDK Migration is totally free and self-paced. Do yourself a favor and start preparing about OpenJDK migration today.
Discover effective k8s debugging strategies, from kubectl debug and ephemeral containers to debuggers. Troubleshoot production/dev issues.
Use the debugger to find out how a Java application works under the hood, access its memory, and modify it without a single source file
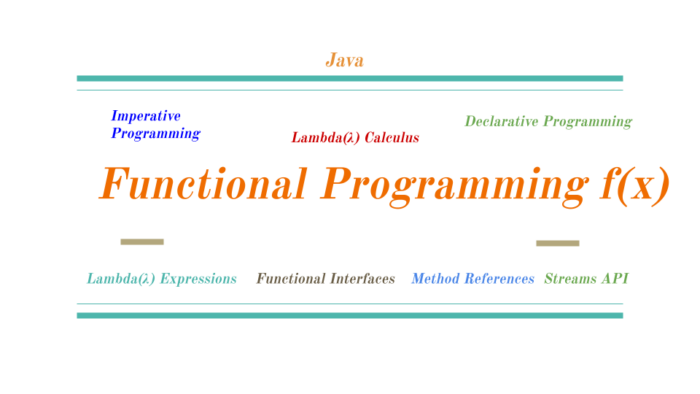
Dive into the world of functional programming in Java using Lambda Expressions, Method References, and Functional Interfaces.
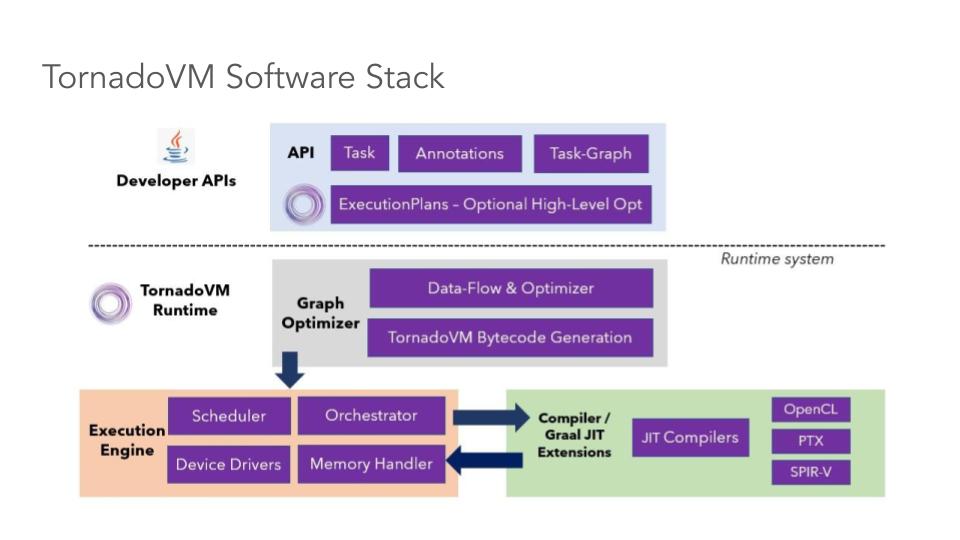
In this article, we have explained the basics of the TornadoVM programming model and the main API blocks.
Learn how to debug unresponsive Java/JVM applications, then reload the fix on the fly, using a hands-on example.


 19,873 views
Task scheduler in Java - JobRunr, a powerful java background job processing library. Learn how to enqueue tasks and schedule recurring …
Software testing functions as a critical debugging tool, significantly enhancing code reliability and streamlining the development process.