

Allocation Profiling in Java
Trouble finding memory leaks in a Java program? Learn how allocation profiling can reveal bugs and help you troubleshoot Java performance.
Trouble finding memory leaks in a Java program? Learn how allocation profiling can reveal bugs and help you troubleshoot Java performance.
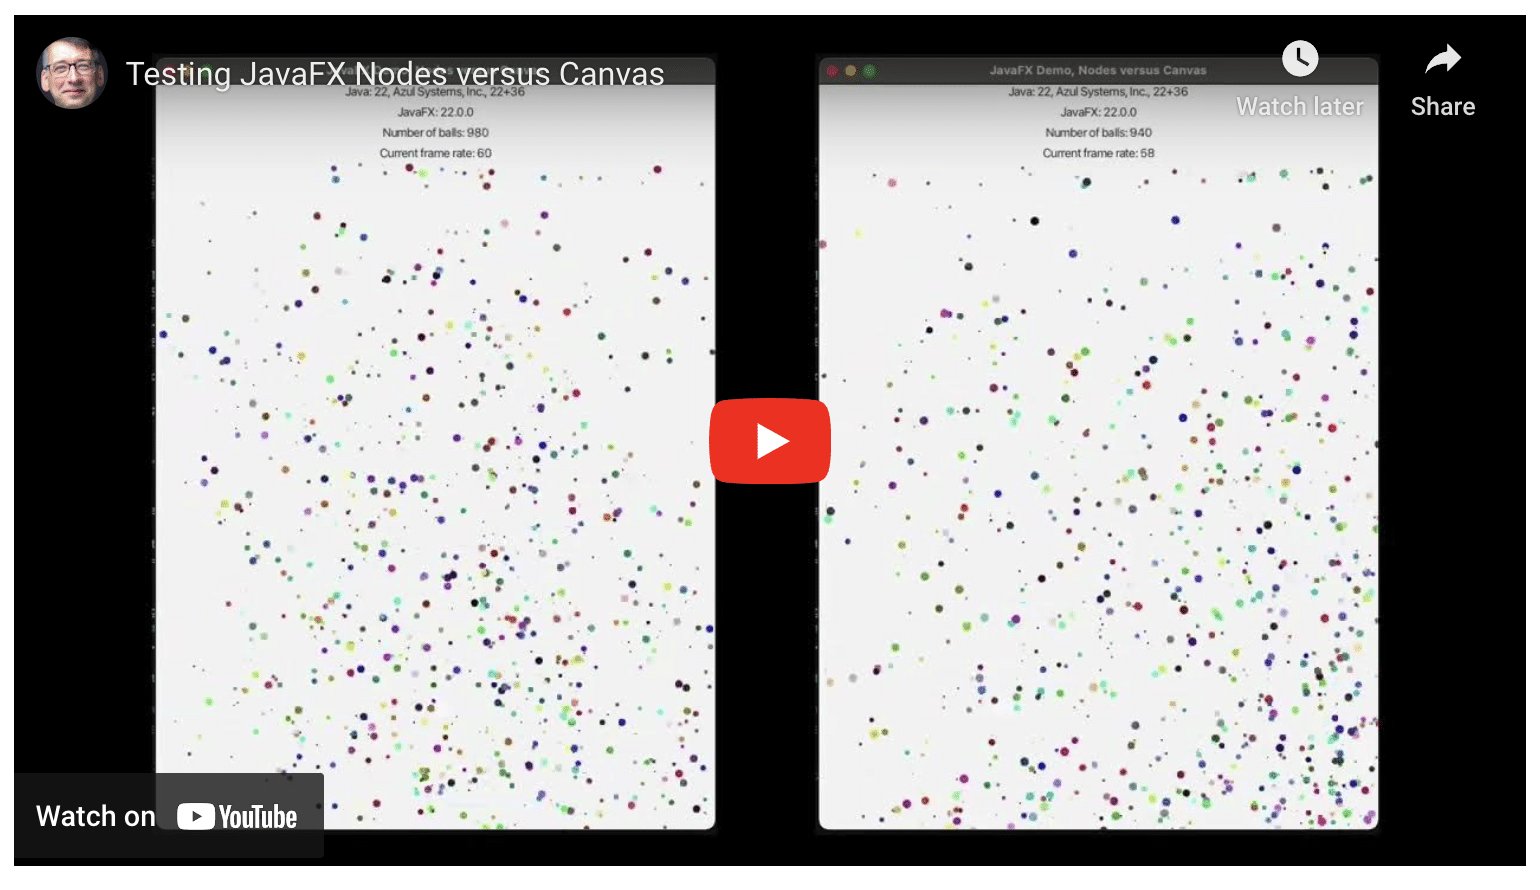
An experiment showing that you can add roughly 10 times more objects to the Canvas before the framerate drops compared to the number of …
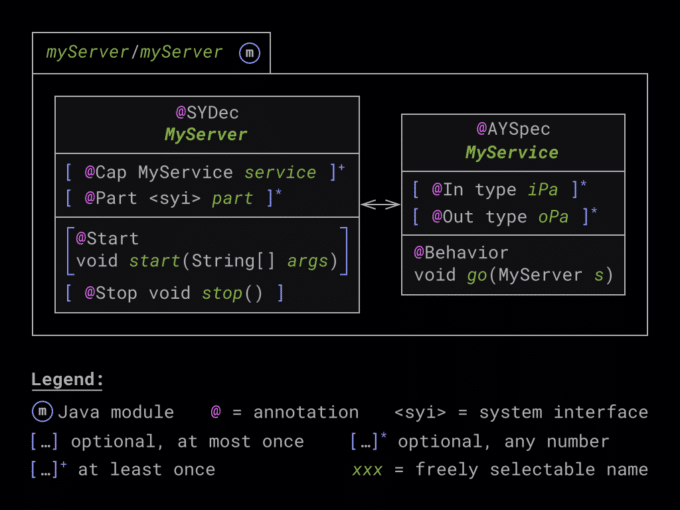
See how FEPCOS-J relieves developers of the network programming required to implement a client-server application in Java.
Learn how to troubleshoot and optimize Java code with IntelliJ Profiler – using createDirectories() as an example.
Use the debugger to find out how a Java application works under the hood, access its memory, and modify it without a single source file
How I first limited my usage of BPMN and then unlocked its true power when I benefited from persistent storage.


 19,873 views
Task scheduler in Java - JobRunr, a powerful java background job processing library. Learn how to enqueue tasks and schedule recurring …
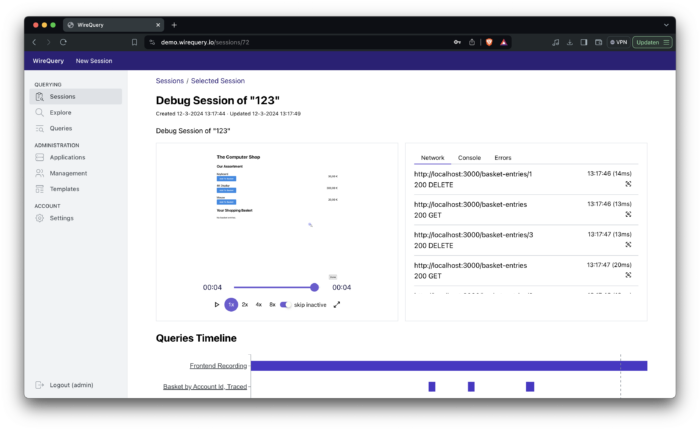
WireQuery is a tool that helps you solve user-reported issues by combining session replay with capturing API calls. In this article, I will …
Learn how to use IntelliJ IDEA's Pause – a lesser known feature that will help you diagnose UI freezes, deadlocks, livelocks, and more
Users of the Java development tool FEPCOS-J can create a multithreaded server in Java without thread or network programming. Read more.