Diagrams as Code: Mermaid Support on the new Foojay

Some things are much easier to show than to describe. A request travelling through three services, a class hierarchy, the states a connection moves through: a paragraph explaining it takes real effort to write and still leaves the reader assembling the picture themselves.
The usual answer is to open a drawing tool, export a PNG, and drop it in the article folder. That works, and it is what most Foojay articles have done so far. It also means the diagram is now a binary file that nobody can review, nobody can correct a typo in, and nobody can update without finding the original file again, assuming they still have it.
So Foojay articles now support Mermaid: you write a diagram as a fenced code block, and it renders as an actual diagram. Thanks to Maximillian Arruda for requesting it.
The short version
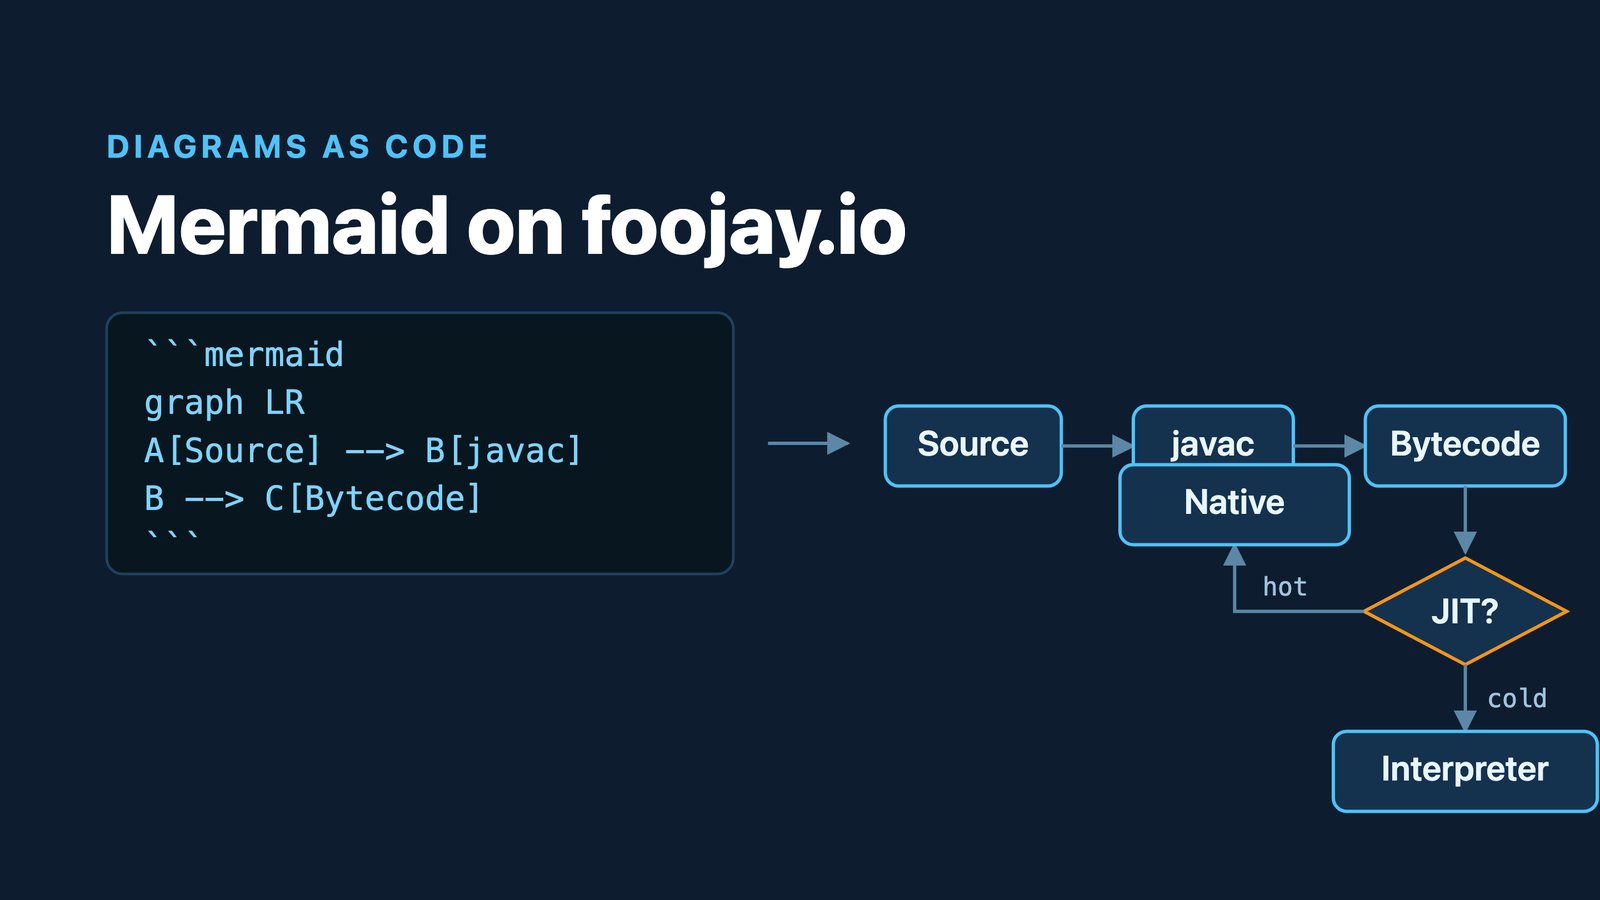
Put your diagram in a mermaid code block:
```mermaid
graph LR
    A[Source] --> B[javac]
    B --> C[Bytecode]
    C --> D{JIT?}
    D -->|Hot| E[Native code]
    D -->|Cold| F[Interpreter]
```
and the article shows this:
graph LR
    A[Source] --> B[javac]
    B --> C[Bytecode]
    C --> D{JIT?}
    D -->|Hot| E[Native code]
    D -->|Cold| F[Interpreter]
There is no frontmatter flag to set and nothing to enable. If your article
contains a mermaid block you get diagrams; if it doesn’t, nothing extra is
loaded.
A few examples
Mermaid covers a lot of diagram types. These are the ones that come up most in the kind of articles Foojay publishes. Check the source of this article for the code blocks that produced them.
Sequence diagrams
A sequence diagram is very useful to explain more than one process. This one is difficult to draw by hand, because every change moves every arrow below it.
sequenceDiagram
    autonumber
    participant C as Client
    participant G as Gateway
    participant S as Order Service
    participant D as Database

    C->>G: POST /orders
    G->>S: createOrder(...)
    S->>D: INSERT
    D-->>S: order id
    S-->>G: 201 Created
    G-->>C: 201 Created
    Note over S,D: Retried once on a<br/>constraint violation
Class diagrams
This one is useful to explain an API shape or a small hierarchy without pasting multiple sources.
classDiagram
    class Shape {
        <<interface>>
        +double area()
    }
    class Circle {
        -double radius
        +double area()
    }
    class Rectangle {
        -double width
        -double height
        +double area()
    }
    Shape <|.. Circle
    Shape <|.. Rectangle
Note that an interface is a class carrying an <<interface>> annotation as there is no interface keyword, which is an easy thing to trip over coming from Java.
State diagrams
For anything with a lifecycle like a connection, a session, a virtual thread, a build.
stateDiagram-v2
    [*] --> New
    New --> Runnable: start()
    Runnable --> Running: scheduled
    Running --> Blocked: waits on monitor
    Blocked --> Runnable: monitor released
    Running --> Terminated: run() returns
    Terminated --> [*]
Entity-relationship diagrams
If you need to explain a database schema and the relations, this is the one to use.
erDiagram
    AUTHOR ||--o{ ARTICLE : writes
    ARTICLE }o--|| CATEGORY : "filed under"
    ARTICLE {
        string slug
        string title
        date published
    }
Gantt charts
Handy for a release timeline or a migration plan.
gantt
    dateFormat YYYY-MM-DD
    axisFormat %b
    title A JDK upgrade, roughly
    section Preparation
    Inventory dependencies :a1, 2026-09-01, 30d
    Update build tooling   :a2, after a1, 20d
    section Migration
    Compile on the new JDK :b1, after a2, 25d
    Run on the new JDK     :b2, after b1, 35d
Why this is worth using
A diagram in a code block is reviewable. Foojay articles arrive as pull requests. A PNG shows up in a diff as “binary file changed” while a Mermaid diagram shows up as the lines you altered. A reviewer can spot that an arrow points the wrong way, and you can fix it by editing one line rather than reopening a drawing tool.
It stays correct. When the thing you described changes, you edit two words instead of recreating an image. The diagrams that go stale are the ones that are expensive to update.
It reads well in both themes. Diagrams follow the site’s light and dark theme, and re-draw when a reader switches. An exported PNG has one background colour, which is why a lot of diagrams on the web are a white rectangle in the middle of a dark page. Try it out and toggle the theme with the button in the menu top bar of this page.
It stays sharp. It is an SVG, so it scales to whatever screen the reader brought.
It is the same syntax you already use. GitHub and GitLab render mermaid
blocks in issues, pull requests and README files. A diagram from your project’s README can be pasted into an article unchanged.
Things to know
- Nothing to switch on. No frontmatter flag is needed. Write the fence and you get a diagram. Pages without one don’t load the diagram library at all.
- Check your syntax in the Mermaid live editor before submitting. If a diagram doesn’t parse, that one diagram is replaced by an error message in the rendered article.
- Don’t hard-code colours. Mermaid supports styling directives, but a colour chosen for a light background tends to disappear on a dark one. The default theming already follows the reader’s choice.
- Keep them small. A diagram with forty nodes is unreadable on a small screen. Several small diagrams beat one enormous one.
- Diagrams are not a substitute for alt text. If a diagram carries something essential, say it in the surrounding prose too. That serves screen-reader users, and it readers using their phone.
Images are of course still fine, and still the right answer for screenshots, photos and anything hand-drawn.
Writing for Foojay
Foojay runs on contributions, and everything here, including this feature, is in the open. template/post.md in the repository documents every formatting feature available to an author, Mermaid included, and How to submit your next article walks through the whole process.
If you spot something missing, open an issue or a pull request.
Found a mistake, or something to add? Edit this page on GitHub

Frank Delporte
Frank Delporte is a Java Champion, Java Developer, Senior Technical Writer at Azul, Blogger, Author of "Java Programming for Raspberry Pi - A Hands-On Guide to Electronics and IoT Projects", and Open-Source Contributor for Pi4J, Lottie4J, Sheetmusic4J and …