When you're diagnosing a problem in a Java application, it is advisable to create a thread dump, which is a snapshot of the state of the threads of a Java process. A thread dump is written in plain text so that it can be examined in a variety of tools, including text editors, or uploaded to advanced analyzers and profilers. By generating a snapshot of the state of the threads of a Java process, you're able to examine the activity of all the threads, that is, the content of the thread's stack.
Multiple tools are available to help you create thread dumps. In the OpenJDK, you'll find a variety of utilities that you can use to generate a Java application's thread dump. You can find them all under the "bin" folder within the OpenJDK home directory. And, as a consequence, you can run these utilities from the command line, assuming that the home directory is on your system path.
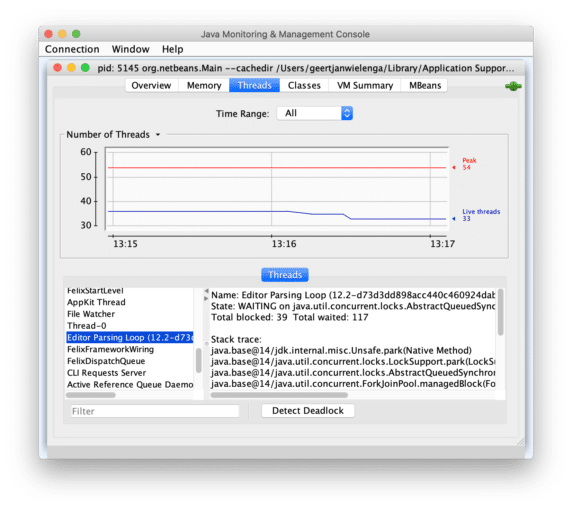
- jconsole. Enables you to inspect the stack trace per thread.

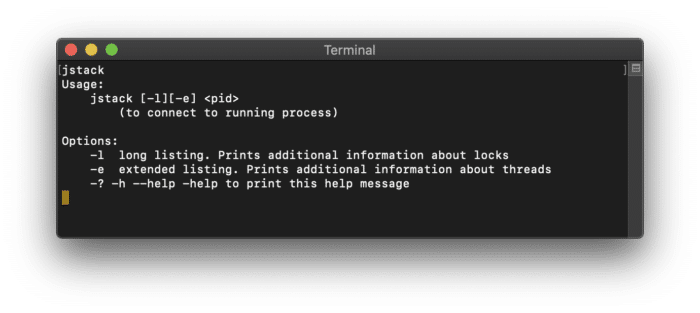
Once you've opened jconsole and connected it to a running Java process, go to the Threads tab, and then take a look at each thread's stack trace. - jstack. Enables you to generate a thread dump, taking the "pid" of a process and displaying the thread dump in the console or, alternatively, redirecting its output to a file. For example, "jstack 5145 > /Users/me/Desktop/dump-5145.txt".

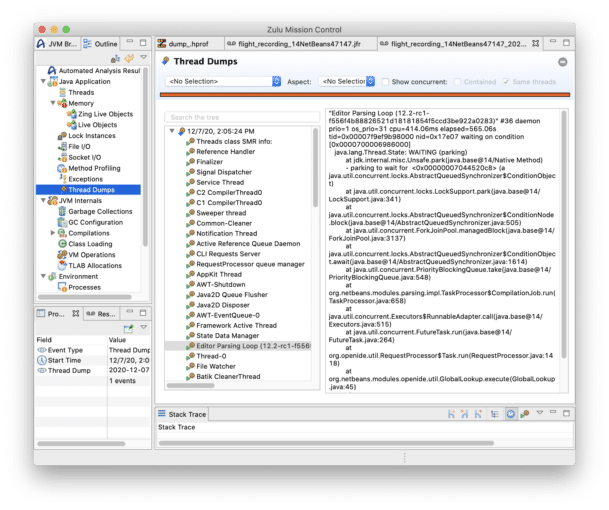
Tip: Run "jps" to see the "pid" of each available process. - JDK Mission Control and JDK Flight Recorder. Enables collection and analysis of Java processes, including generating and analysis of thread dumps.

For details on these tools, see the JDK Flight Recorder section here on Foojay.