

Polyglot Cloud Native Debugging: Beyond APM and Logging
- January 18, 2022
- 8 min read
I’ve done quite a few conference talks since I became a developer advocate for Lightrun. One of my most popular talks has a title similar to the title of this article. In this article I’ll try to cover the gist of the talk.
Cloud-Native Applications
There’s practically an alphabet soup of terms covering public cloud, hybrid cloud, etc. There’s also a lot of overlap between the various terms. The nice thing about this topic is that it applies, regardless. You will run into problems with microservices, architecture and monolithic applications or serverless.
Debugging is universal and nowadays so is polyglot. With the recent log4j shell bug, a lot of companies discovered they use Java. Python is everywhere and Node is also deeply entrenched by now. It’s rare to find a cloud platform that doesn’t have all three of them somewhere… A polyglot approach improves time to market by leveraging best of breed to deliver a product faster.
But I’m getting ahead of myself. Let’s take a step back and discuss the problem.
Cloud Native Lives and Dies by APMs and Logs
Without those two, we’re blind. Regardless of the architecture you choose. If you don’t have observability, you have a cat in a box (I’ll get back to it).
We need to provision cloud resources, need to know if things work… Actually DevOps teams need to know those things. R&D should know it too, but they aren’t immediately connected to that. Back in the days before cloud-native applications and the advent of DevOps, we would often deploy things ourselves.
This often ended badly.
Observability in the 90s - Kick The Server
DevOps practices and cloud native revolutionized this painful and problematic approach. They did it by removing the wildcard problematic variable: R&D. Thanks to DevOps teams, we enjoy a level of uptime we could only dream of 20 years ago. Private cloud made sure that these benefits of cloud are now available to everyone.
Container orchestration, microservice architecture, serverless, etc. made scaling easier. But it also made application deployment far more challenging. Cloud infrastructures are much easier to deploy thanks to IaC solutions, but the complexity shifted.
Troubleshooting cloud-native applications is harder. We have amazing observability tools but they’re dealing with complex underlying infrastructure.
Cloud Native Logs
In recent years, cloud-native apps rely more and more on modern logging infrastructure. These aren’t our old log files. Cloud provider logging solutions handle ingestion, search, meta-data, PII reduction, etc. at scale. I can’t imagine running a major deployment without one of those solutions.
Logs are wonderful, but they have two major drawbacks…
1. Add Log, Test, Deploy, Rinse, Repeat
This is the situation with logging. We aren’t clairvoyant. We don’t know how our native applications will fail in the deployment target. If a log is missing, we need to go through CI/CD, which can take hours (or days for some deployment processes). Then you need to go through that again, for the fix or additional logging.
During that time, there’s a bug in production and the development teams end up wasting time.
As a result, over-logging is pretty common for a cloud application. This leads us to a different problem.
2. Performance and Expense
Logging a cloud-native application at scale can quickly become your biggest expense. We can reduce IO costs by caching, but even a read only operation that has a perfect cache hit will produce a log. Modern cloud applications must log everything due to scale. The size of ingested logs can become prohibitive.
Performance hit of over-logging can compound this problem. Ingesting more data can seriously impact performance, which would require more containers to handle the same load. Additional container images breed complexity, which means more bugs and a bigger need for logs.
When we observe, we affect the observer. It’s as true for Schrödinger’s cat as it is for scalable applications.
Observability Tools/APMs
Modern observability tools are a marvel. I feel there should be a German word to describe the satisfaction one gets from a detailed APM dashboard. These tools enable the production of complex applications like nothing we’ve seen before.
These tools are wonderful. I don’t want to qualify that with a "but they are…". They’re perfect. For the operations team, who are the target market of these tools. They’re nice for R&D teams too, but we aren’t the target market.
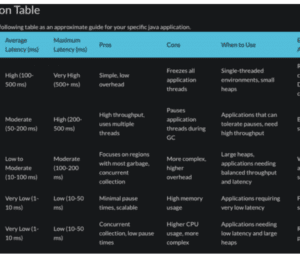
1. Check Engine
I usually compare these tools to the check engine light or even the bat signal. They tell us there’s a problem with cloud-native services, but they aren’t exact. E.g. if your car shows the check engine light, you take it to the mechanic. She then connects his computer directly to the engine in order to debug the problem…
The job of these tools is to detect a problem and alert us. As a bonus, they often give us the initial direction of the problem, but if the solution isn’t immediately obvious, developers are left with limited options.
2. Performance
For most apps, the overhead of observability is acceptable and well worth it. But there are limits. Most observability tools can be tuned to observe more information and trade off performance.
This is usually a problematic notion that brings us back to the discussion of scaling infrastructure to support observability.
Debugging
When we native applications we can debug them using existing native technologies such as platform debuggers. Those work great for local debugging but at scale (especially horizontal scaling) they have some problems:
- Security - I’ve gone on record before on the security issues of remote debugging. Specifically JDWP but also other protocols
- Impractical - When dealing with lightweight containers or serverless, we don’t have a place to attach our debugger. We can have multiple containers and a user might hit an arbitrary server
- Stability - I’ve heard stories of servers stuck in production because a breakpoint wouldn’t release. It’s very easy to crash production with a debugger
If we work around those issues, debuggers are the perfect tool. R&D knows how to use them as they are a core tenant in software development.
Debugging in the Cloud Environment
This is where continuous observability steps in. Observability tools work by monitoring the entire system and exposing relevant information.
Continuous observability flips the switch, we ask the system about specific information we would like to know. It’s the natural progression of problem solving… An observability platform points to a problem in our native software, and we use continuous observability to investigate the problem.
As a Debugger
There are many tools that we can classify as continuous observability tools. I’ll focus on Lightrun, which exposes its capabilities as a debugger for cloud-native computing environments. It differs from existing observability tools in the following ways:
- IDE Integration - this is a tool for R&D. It works on the source code level directly in the IDE, like the debugger
- Low impact - continuous observability tools provide more information with lower overhead. They accomplish this by only observing the area of code you’re debugging at the moment. If the tool isn’t used, the impact is minimal
- Secure - there are several approaches to deployment (public cloud, on-prem, etc.). However, R&D doesn’t get direct access to the container runtime. DevOps still has full control and R&D can’t accidentally destroy a production environment (there are other protections such as PII reduction, blocklists etc.)
- Scale - you can debug multiple servers at once with tagging and similar features. No need to search through a huge cloud deployment
- Snapshots not Breakpoints - Breakpoints are a core concept in debugging, but we obviously can’t use them when debugging a cloud server. Snapshots provide the same functionality (stack trace, frame variable states, etc.), without suspending the executing thread
Logging in Dynamic Environments
Some software developers consider logging to be superior to debugging. I always considered them to be two approaches that excel at different things. Logging is debugging.
The static nature of logging is its biggest problem. If we could just inject a log dynamically, it would fit far better into the cloud-native architecture.
Notice, we still need existing logging to give us context and direction. This is simply for those cases where a developer is reviewing the logs and is missing a specific log. This solves the problem of over-logging, as a new log can be injected dynamically as needed.
Furthermore, injected logs are interlaced and ingested with the native logs. This gives them the context we need to understand the root cause of a problem.
Metrics to Verify Instantly
Debugging is first and foremost the practice of verifying assumptions. But some assumptions are harder to verify with snapshots or logs, e.g. "this is the method that slows my docker containers".
This is something for which we would normally use a profiler, but it’s problematic to do in a production setting. Alternatively, we use a timer where we take the current time on method entry and log it on exit…
That’s great for a development machine, but deploying something like this to production is "noisy" and problematic. We usually want to keep narrowing the scope of measurements to find the true culprit.
That’s where metrics come in. We can add counters, timers, and more to measure the execution of a specific method. We can even pipe this information to Prometheus and other such tools. When an APM alerts us to a performance penalty in our finished application code, we can narrow it down with a metric.
Conditions to Pinpoint Issues
I somewhat side-stepped one of the biggest features in continuous observability conditions.
Let’s say I want to place a snapshot, log or metric on critical code. It will get hit instantly.
That can be exactly what I want, but what if I want to debug a problem that happens only under specific conditions, e.g. to a specific user…
Debuggers solved this problem before by coming up with conditional breakpoints. This applies to every action on a continuous observability platform. You can place a condition on any action within the platform, e.g. I can set a snapshot that would only be triggered by a user with the given ID.
Modern Applications
We sometimes tread more lightly when building in the cloud-native world. We know how a minor change can have a cascading effect and we know how hard it is to track such issues. Continuous observability changes that dynamic, high-impact changes can be made more easily as we now have the tools to deal with them. In that sense, a debugger serves as a safety net for faster code to production cycles.
But even if you don’t subscribe to a more "ambitious" continuous deployment strategy. The additional safety net afforded by continuous observability provides many advantages for your entire application.
E.g. Have you ever asked yourself if a particular method is even used in production?
Is the dependent service at fault for the failure or is it my bug?
With continuous observability, you can find out right from the comfort of your IDE.
In that sense, it’s the realization of cloud-native computing by giving developers a direct channel to the applicable information.
Polyglot, Cross Platform, Cross Language
Most observability tools are platform agnostic at the system level. Continuous observability tools are a bit more complex. A continuous observability tool works at the code level and needs deep access to the language runtime. As such, it’s deeply adopted in each programming language on every platform. It’s technically possible to support all languages, but there are challenges involved.
In the demo video above, I show debugging a snapshot in NodeJS which leads me to code in a Spring Boot Java backend. Using such independent services isn’t out of the ordinary for the cloud-native approach. I didn’t demo a lambda service because of a lack of time. With stateless services and serverless, the need is even greater. Debugging serverless locally is so difficult some developers advocate deploying directly to production (through CD and testing).
With a continuous observability tool, we can use tags creatively to monitor serverless services as they come online and bind the right actions to the function.
TL;DR
Continuous observability is already revolutionizing the cloud native industry in the same way observability, modern logging and docker containers did more than a decade ago. It fills an important blind spot in our current set of native technologies: a tool for developers that lets them deep dive production issues in the finished application code.
Production bugs are like spores, they survived QA, staging, etc. They are resilient; we need heavy guns to kill them at scale. Cloud-native technologies made the scale much bigger and, as a result, much harder to debug.
With serverless, microservices and worker frameworks (e.g. AirFlow, Spark, etc.) things are even more dire. The lifecycle is so difficult some developers accept a relatively high failure rate as "the cost of doing business".
I hope this article will make your first steps into continuous observability. I believe this technology can facilitate a new generation of applications that will change the customer experience and yours.
Follow me on Twitter to learn more and get updates for future posts.
- January 18, 2022
- 8 min read
Author, DevRel, Blogger, Open Source Hacker, Java Rockstar, Conference Speaker, Instructor and Entrepreneur.


Comments (0)
No comments yet. Be the first.