All 0 Likes
Summer with Covid-19 in Australia, New Zealand and Polynesia
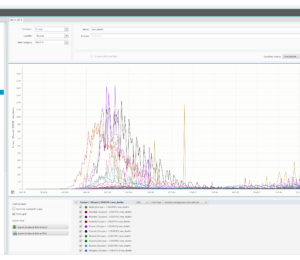
Over the last weeks, we looked at the current Covid-19 developments in Europe, China and South America. In Europe, we saw that the second wave is breaking and has already peaked in most countries. The data from the Our World In Data (OWID) COVID-19 data set includes the pseudo-continent of "Oceania" as a collective term for all countries in Australia, New Zealand and Polynesia. Let's take a look at this area with Software-ECG.
Software-ECG is a free time series analysis tool originally developed for time series analysis for system analysis of computer problems in distributed systems. With the Covid-19 edition, QAware has adapted the tool so that the current data from the data hub of the University of Oxford are automatically loaded and immediately available for analysis.
Last week, we compared the situation in Europe and in China and discovered interesting anomalies in the data on Russia, Ukraine, Serbia, and China.
This week, we are going to compare Europe with South America.

In last week’s blog, we took a look at the current situation in Europe. We saw that the second wave is already breaking in Europe. Over the past week, this trend seems to have continued.
But there are some countries where the graphs are different. These are Russia, Serbia and Ukraine. Let us also take a look at countries outside of Europe and analyze China. This country also has a very interesting chart.
In Europe, the number of people who tested positive is now declining.
With the Software ECG Covid-19 Edition, you can evaluate the most important Covid-19 time series across countries.
The ECG offers the possibility to display several metrics via logical expressions and to limit them to time periods. Currently you can observe very nicely the breaking of the 2nd wave in Europe.
We are not offering yet another dashboard. What we are offering is our best and most powerful tool for time series analysis, combined with the latest, comprehensive data on COVID-19.
Our goal is to provide you with the raw data on COVID-19, included in a tool that lets you analyze, visualize and interpret the impacts of the pandemic on a long term basis.
By providing Software EKG – COVID-19 Edition free of charge, QAware wants to contribute to a better understanding of the pandemic and support the global efforts against it.
If you want to know what I spoke about in @jcon_conference in Germany, here's an interview I did at the @foojayio podcast:
#Java #JCON #JakartaEE #AI #A2A
Our team loves to meet and talk with the Java community from around the world. If you want to learn more. You can find all OmniFish presentations at: https://speakerdeck.com/omnifish, including links to the source code of related demos. Or get in touch for a free consultation call.
Another happy customer :)
"Their expertise and flexible hands-on troubleshooting support accelerated resolution of several unexpected hurdles and ultimately got us to a successful upgrade outcome."
If you would like to discuss how we could help your company, get in touch.
All 0 Comments