

The Second Wave Breaks in Europe
- November 27, 2020
- 3 min read
In this series of blog posts (see part 1 here), we're looking at the current figures of the Covid-19 pandemic with Software-ECG.
Software-ECG is a free time series analysis tool originally developed for time series analysis for system analysis of computer problems in distributed systems. With the COVID-19 edition, QAware has adapted the tool so that the current data from the data hub of the University of Oxford are automatically loaded and immediately available for analysis. More information about the Software-ECG and download links can be found here on foojay.
Note: The German translation for ECG is EKG (Elektrokardiogramm). We are German, therefore we use the names “Software ECG” and “Software EKG” as synonyms.
Software-ECG ist build on OpenJDK and JavaFX. It leverages the power of a compiled language with a native rich client framework.
CW 48: The Second Wave Breaks in Europe
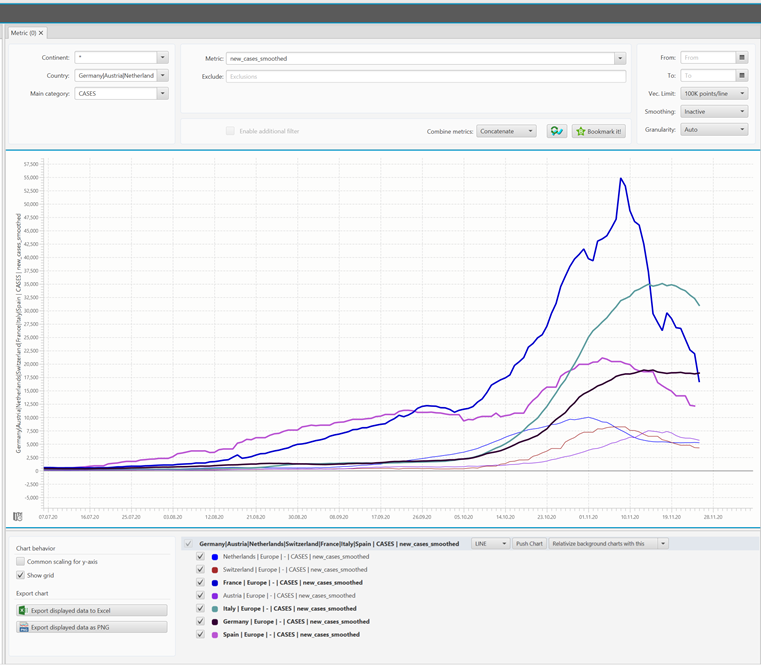
In Europe, the number of people who tested positive is now declining. For this purpose, the respective countries can be entered in the selection box using the pipe operator.

The input string in the editable dropdown has the form “country1 | country2 | countryN”. The pipe operator is a logical OR which than selects all data from country1 and countryN.
As a result, the ECG then shows all the countries selected. With the mouse, you can now zoom into the interesting parts. Here is the data from 07/07/2020 until today (11/25/2020).
The number of positive tests correlates directly with the total number of tests. Dividing the number of positive tests by the total number gives the infection rate. In the Our World in Data Covid-19 data, this metric is called the “positive rate”. In the ECG you can see it directly:
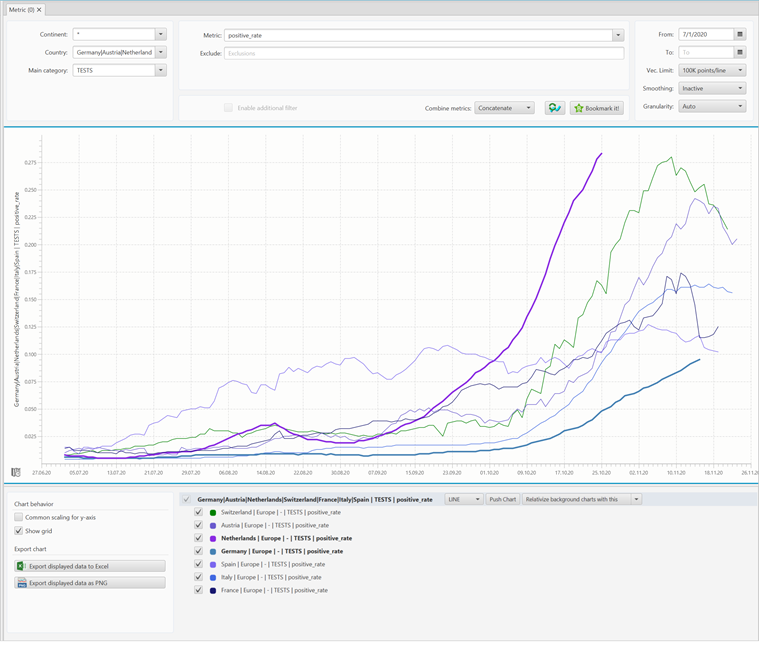
The data shows also here a flattening or breaking of the 2nd wave. Since at the present time, the data for the Netherlands (purple line) is available only up to 10/25/20, and the data for Germany (blue line) up to 11/15/20, one cannot make a clear statement here. (In next week’s blog we will take another look at the curve and investigate whether the curve flattens or breaks.)
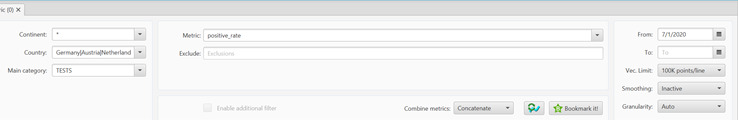
A very useful feature is the date selection. The date period can be set by zooming in or out or by using the Date Picker in the upper right corner.
Some Countries Already Have Constant Or Even Falling Mortality Rates
The number of people who have died of or with Covid-19 is also flattening out in all countries except Italy and Germany.
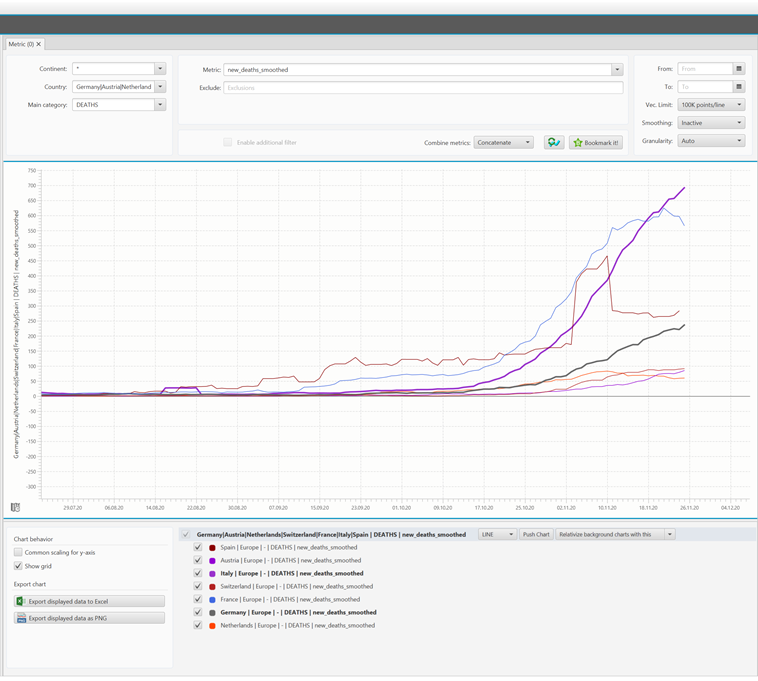
It is interesting to note that Italy has almost three times as high a death rate as Germany.
The curves are smooth — this smooth metric makes a lot of sense, because the curves fluctuate a lot on a daily basis, which has to do not only with statistical and medical reasons, but also with organizational reasons of data transfer from laboratories and authorities. The non flattend peek values are also available (new_deaths).
Summary
With the Software ECG Covid-19 Edition, you can evaluate the most important Covid-19 time series across countries.
The ECG offers the possibility to display several metrics via logical expressions and to limit them to time periods. Currently you can observe very nicely the breaking of the 2nd wave in Europe.
- November 27, 2020
- 3 min read
Johannes Weigend is a computer scientist, software architect and technical director of QAware Germany. He works as a lecturer at the Technical University of Rosenheim and gives lectures on distributed computing, modern programming languages and graphical user interfaces. Find him on Twitter @JohannesWeigend.


Comments (0)
No comments yet. Be the first.