

COVID-19 Time Series Analysis with Software EKG
- November 20, 2020
- 3 min read
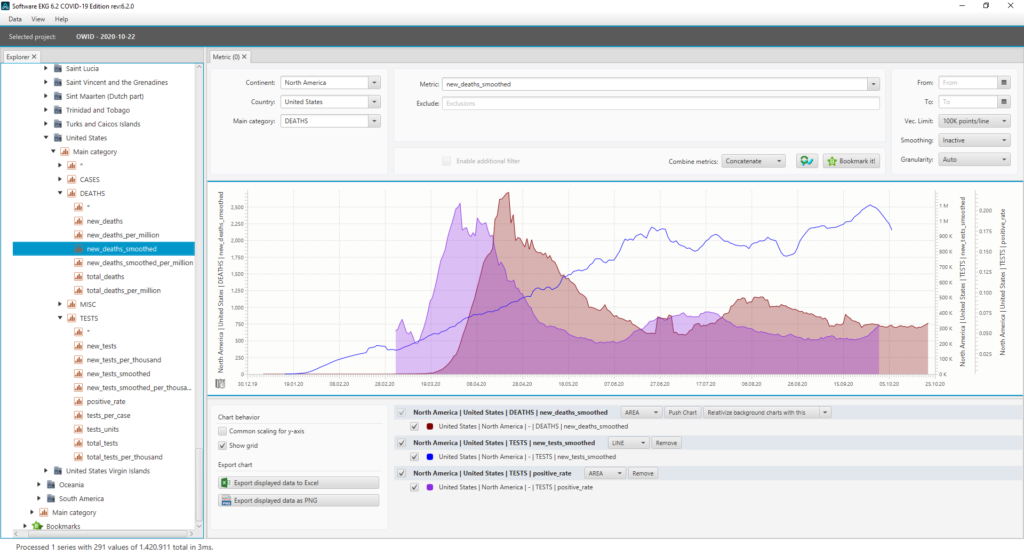
Software-EKG is a powerful tool for time series analysis developed by QAware Software Engineering. Using a highly efficient search index and optimized algorithms, the tool enables you to both visualize and analyze time series containing billions of values.
Our special COVID-19 Edition provides you with the latest data on COVID-19 from all countries worldwide. Not only can you get a detailed overview of the Coronavirus pandemic in a single country, it is also possible to compare different countries with each other using a plethora of metrics like positive test rate, population density or even hospital beds available.
The software was developed with Java 11 and JavaFX. The window management is based on Stagediver.fx, the framework that emulates basic parts of the NetBeans Platform for JavaFX.
Why Time Series Analysis Is Essential
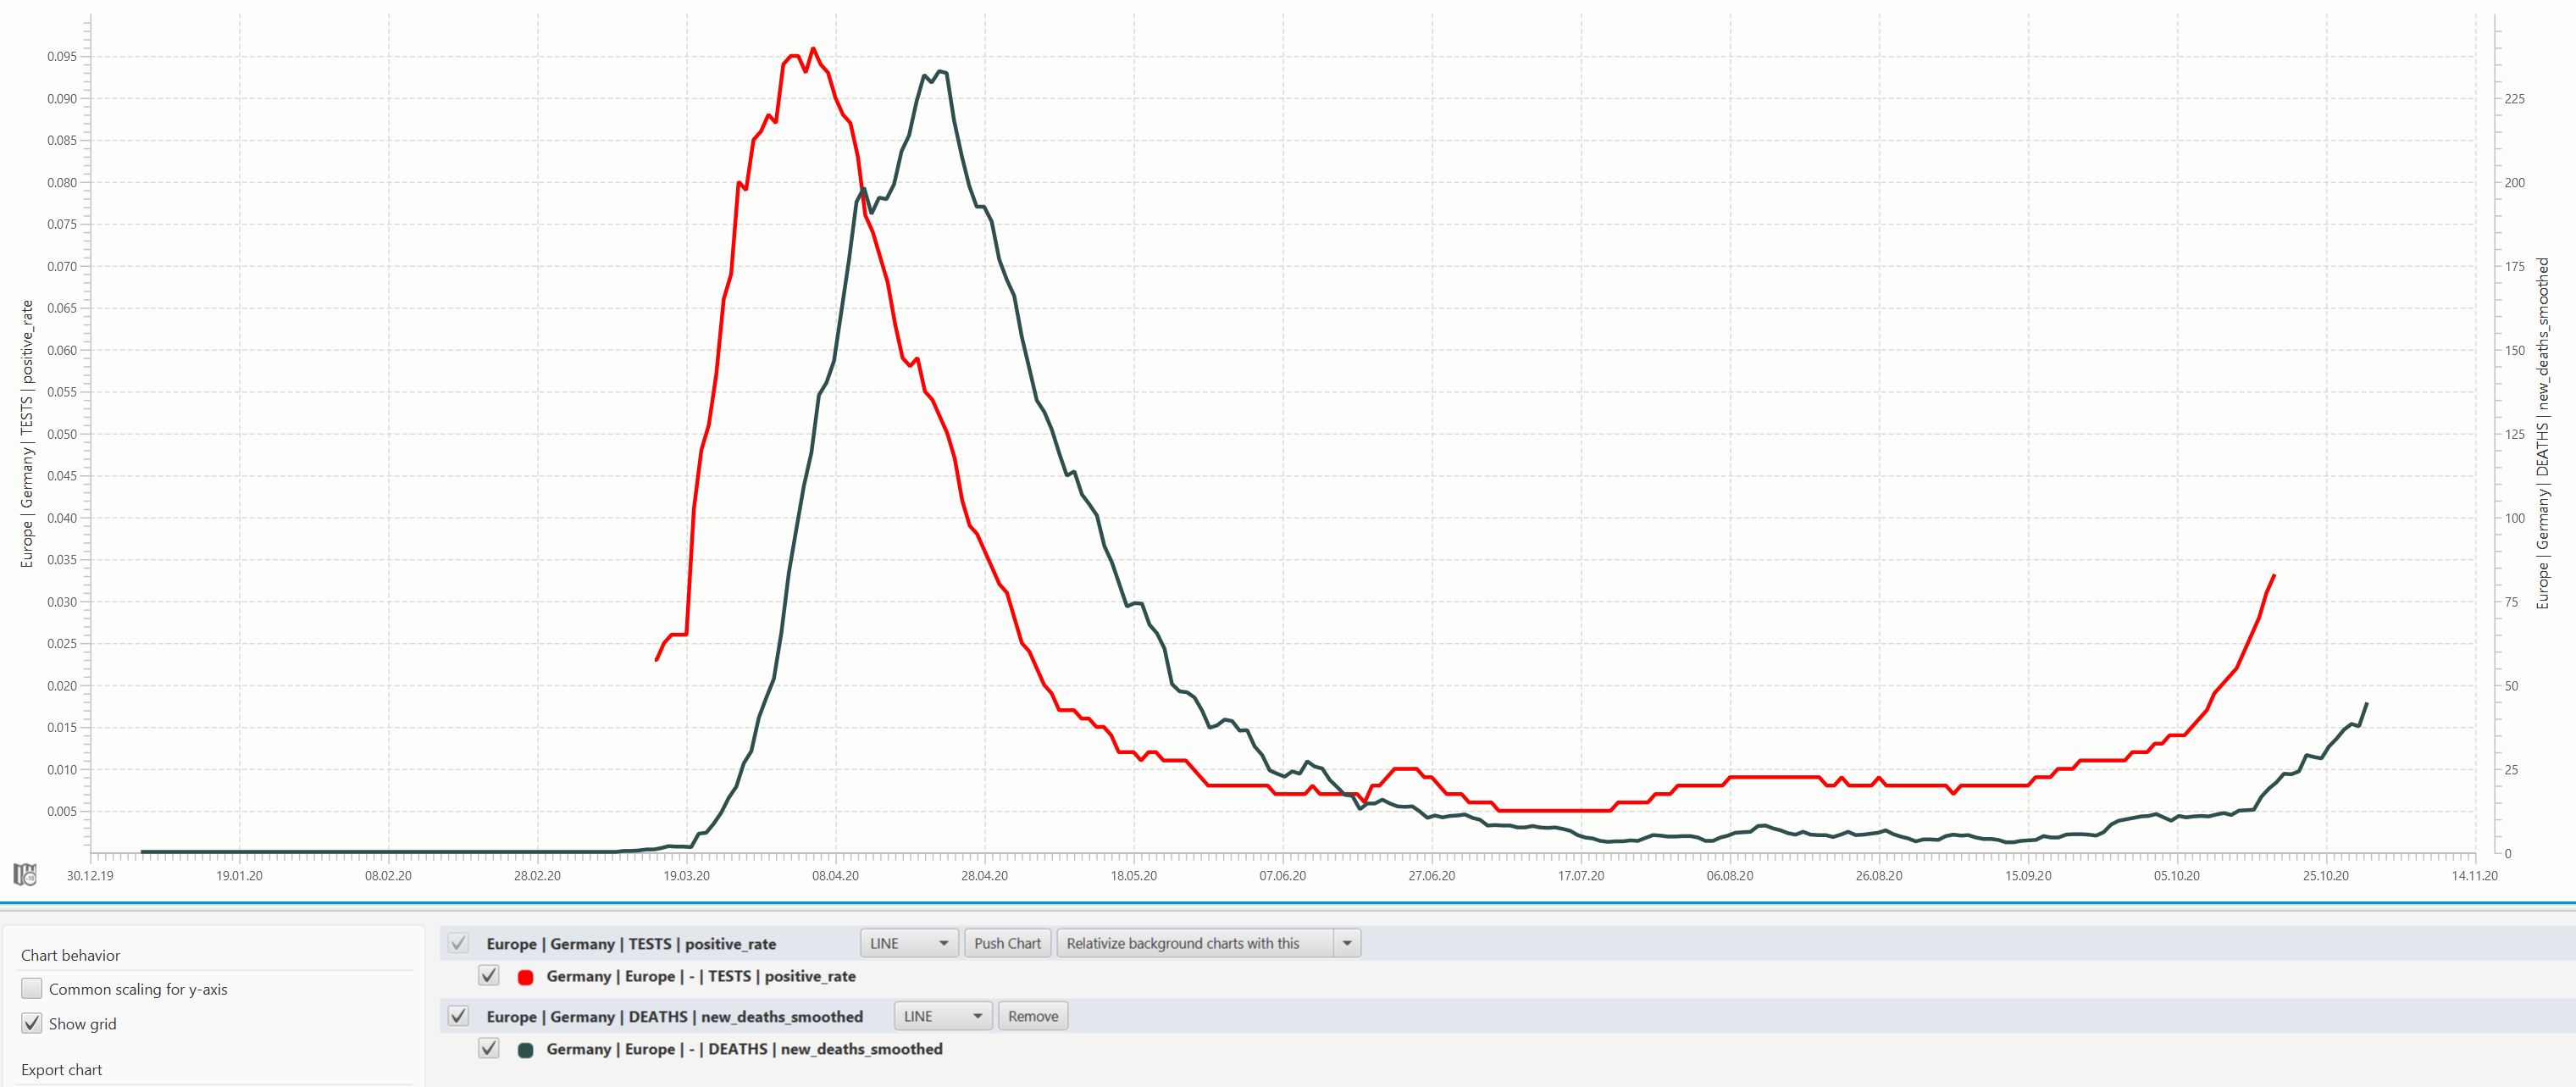
When analyzing the impact of the Corona virus pandemic, considering only absolute numbers will not suffice. Instead, it is crucial to take the dimension of time into account. Thus, time series analysis is the key to fully understand current trends and developments regarding COVID-19 and to detect important correlations between metrics.
See, for example, the correlation between new death cases (black) and positive test rate (red) in Germany in the graph below.
We are not offering yet another dashboard. What we are offering is our best and most powerful tool for time series analysis, combined with the latest, comprehensive data on COVID-19.
Our Mission
Our goal is to provide you with raw data on COVID-19, together with a tool that lets you analyze, visualize, and interpret the impact of the pandemic on a long term basis.
By providing Software EKG - COVID-19 Edition free of charge, QAware wants to contribute to a better understanding of the pandemic and support the global efforts against it.
Our Data Source
Software EKG - COVID-19 Edition uses data from Our World in Data (OWID), a scientific online publication based at the University of Oxford with a focus on large-scale global problems.
OWID data is trusted both in media (BBC, Washington Post, New York Times) and teaching (Harvard, Stanford, Berkeley). As one of the leading organizations publishing global data on the Coronavirus pandemic, OWID has created and maintained a worldwide database on COVID-19.
Please note: We do not, in any way, manipulate or change data gathered by OWID.
How To Use Software EKG - COVID-19 Edition
In order to create the best user experience when using Software EKG - COVID-19 Edition, we have recorded several video tutorials that are meant to give you an easily understandable, concise overview of the tool’s most important features.
How To Interpret The Data
Just as COVID-19 is a complex issue, so is the huge amount of data on the pandemic. Software EKG - COVID-19 Edition provides you with a plethora of metrics that can be used for further analysis.
To fully understand the meaning of each metric, please refer to the official documentation by Our World in Data. Besides an understandable explanation, OWID also provides the source of each metric.
Thus, users can be sure they will get reliable and up-to-date raw data when working with Software EKG - COVID-19 Edition.
Our tool groups the provided data into four logical categories:
- Cases
- Deaths
- Tests
- Miscellaneous data (Misc)
Misc includes various metrics that might be of interest in conjunction with COVID-19 specific data. For example, users might find it informative to compare the positive rate of a country with its population, its median age or the percentage of other diseases like diabetes or cardiovascular diseases. Please note it cannot be guaranteed that data on each metric for each country worldwide will always be available.
The existence of reliable data also depends on the individual circumstances in a certain country as well as on how data is collected by local authorities. Also, it is noteworthy while some metrics like the number of new cases or new tests will change on a daily basis, there are others like population or life expectancy that will remain constant over a longer period of time.
Just as COVID-19 is a complex issue, so is the huge amount of data on the pandemic. Software EKG - COVID-19 Edition provides you with a plethora of metrics that can be used for further analysis. To fully understand the meaning of each metric, please refer to the official documentation by Our World in Data.
How To Get The Tool
In order to download Software EKG - COVID-19 Edition, please visit the official website:
https://qaware.de/software-ekg-covid-edition
We provide downloads for all three major operation systems (Windows, Mac and Linux).
You will also find a detailed FAQ section, should you have any further questions regarding the tool.
- November 20, 2020
- 3 min read
Johannes Weigend is a computer scientist, software architect and technical director of QAware Germany. He works as a lecturer at the Technical University of Rosenheim and gives lectures on distributed computing, modern programming languages and graphical user interfaces. Find him on Twitter @JohannesWeigend.


Comments (0)
No comments yet. Be the first.