

Using Firefox Profiler Beyond the Web
- February 03, 2023
- 9 min read
This blog post is the base for the second half of my upcoming talk at FOSDEM 2023 on the topic "Firefox Profiler beyond the web: Using Firefox Profiler to view Java profiling data."
I detailed in my last blog post how the Firefox Profiler can be used to view Java profiling data:
But I'm of course not the only one who uses Firefox Profiler beyond the web because using it has many advantages: You're essentially getting a prototypical visualization for your data in an afternoon.
Other tools that use Firefox Profiler
There are other tools that output use Firefox Profiler for their front end. A great example is the Rust profiler samply by Markus Stange, the initial developer of Firefox Profiler:
samply is a command line CPU profiler which uses the Firefox profiler as its UI.
At the moment it runs on macOS and Linux. Windows support is planned. samply is still under development and far from finished, but works quite well already.
Give it a try:
% cargo install samply
% samply record ./your-command your-arguments
GiTHUB
Another example is the python profiler FunctionTrace:
A graphical Python profiler that provides a clear view of your application's execution while being both low-overhead and easy to use.
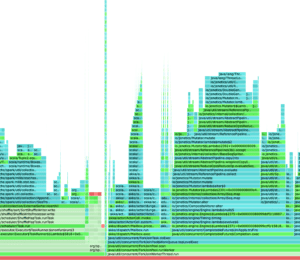
FunctionTrace supports all of the useful profiling views you're familiar with, including Stack Charts, Flame Graphs, and Call Trees, thanks to its integration with the Firefox Profiler.
There are also non-open source uses of Firefox Profiler, Luís Oliveira, for example, works on integration with Lisp:
We're using the Firefox Profiler to debug performance issues at the Dutch Railways dispatching center.
Basic Structure
I hope I convinced you that the Firefox Profiler is really great for visualizing profiling data, even if this data comes from the world beyond web UIs. If not, please read my previous article. The main part of adapting to Firefox Profiler is to convert your data into the profiler format. The data is stored as JSON in a (optionally zipped) file and can be loaded into Firefox Profiler. See Loading in profiles from various sources for more information.
The basic structure of a tool using Firefox Profiler can be as follows, using my plugin as an example:
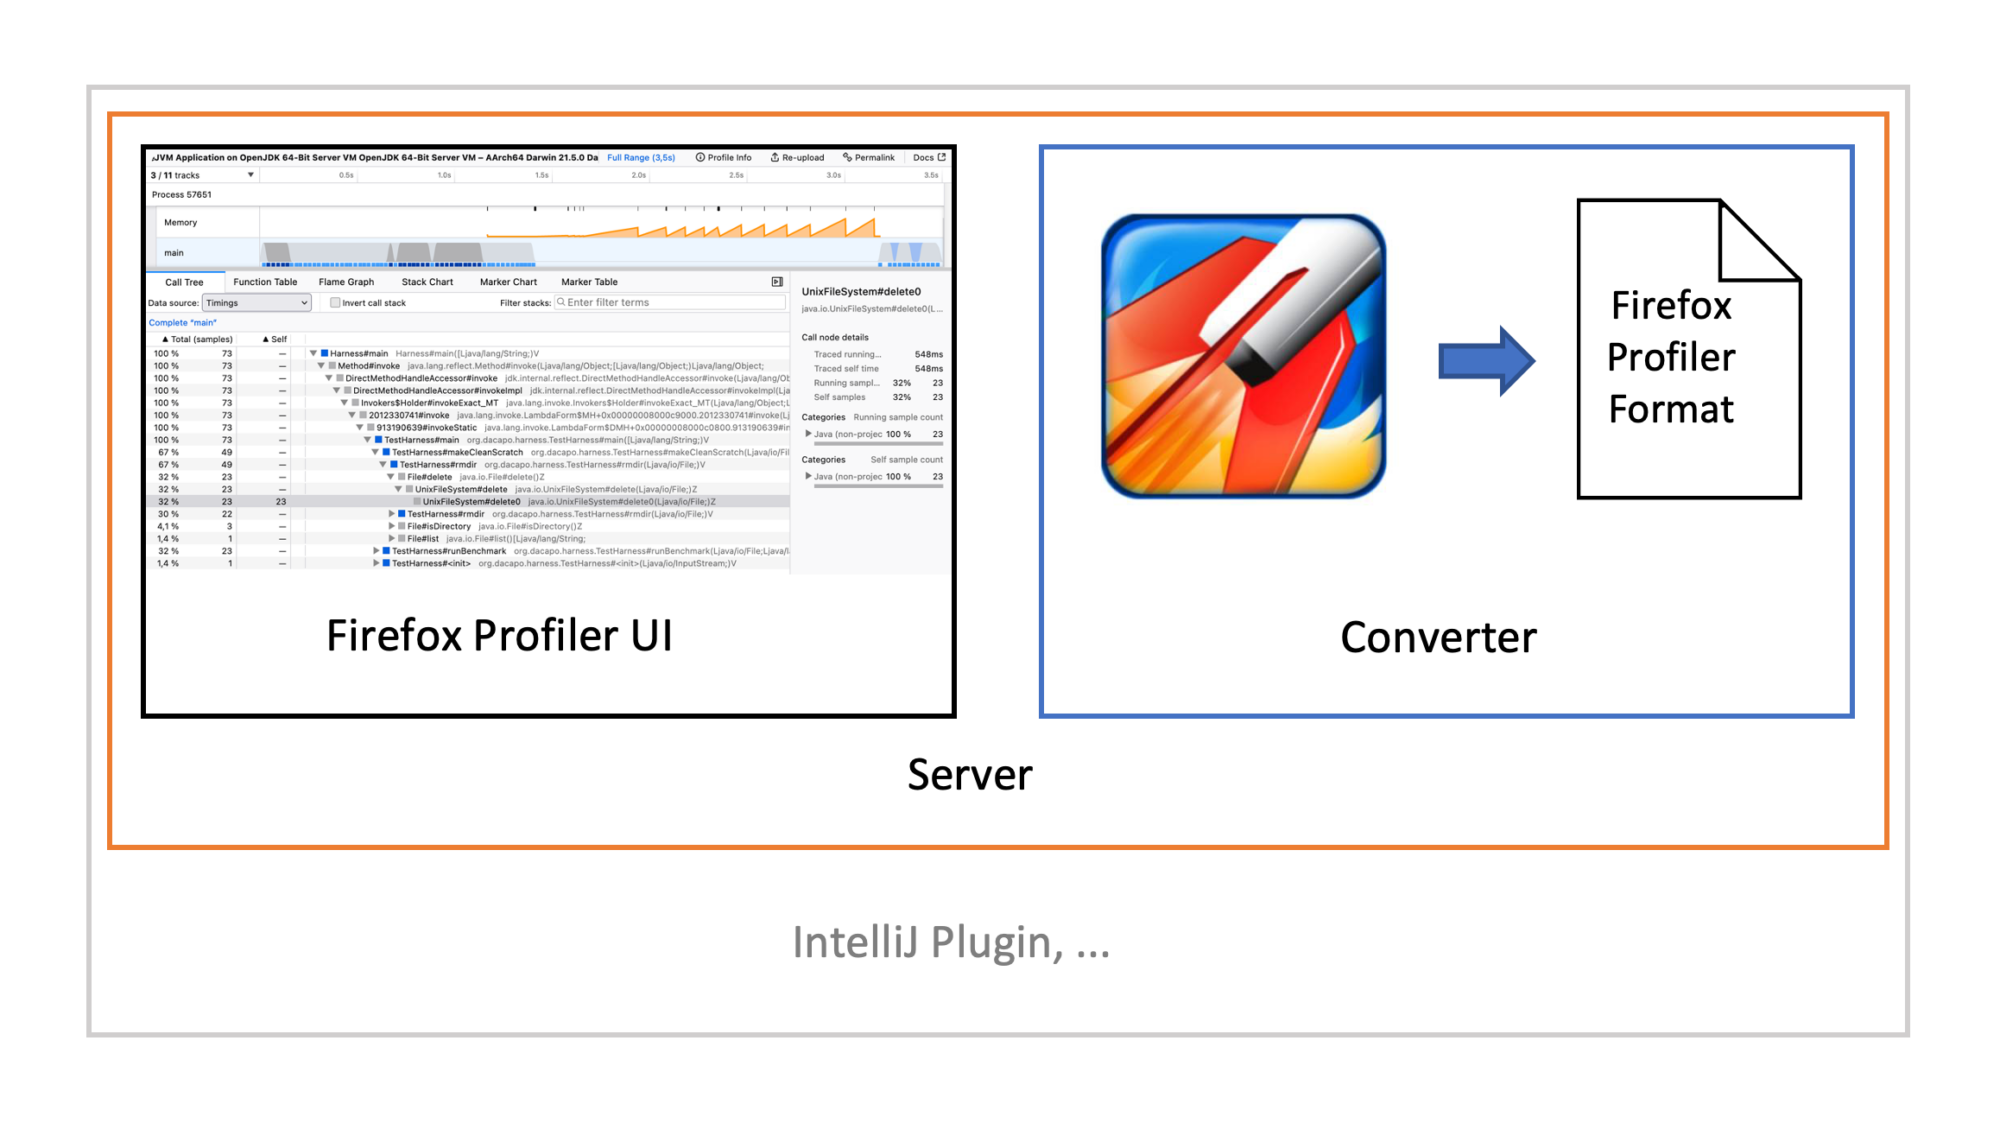
You have a converter from your profile format to the Firefox Profiler format. The converted file is then passed to the Firefox Profiler, either from profiler.firefox.com or a custom fork. You typically then wrap your UI and the converter, hosting both on a small webserver. This web server runs then on e.g. localhost. Hosting your own Firefox Profiler instance has two main advantages: First, you have always a tested combination of Firefox Profiler and Converter. Second, it works offline. The web server can then be embedded into a larger application, showing the UI using an embedded browser.
You can find the type definitions in the types folder of the Firefox Profiler repository. All of the following will be based on this. This part of the article will not focus on all the details, like markers, but more on a bird's eye view of the format, so it will probably still apply with future revisions. I'll also omit parts that are not that useful for non-web use cases. If you have any questions on the file format, feel free to ask them in the matrix channel.
The type definitions are written with flow. It is helpful to read its documentation if you want to understand the intricacies. But for now, it should suffice to know that x?: type means that the property x is optional and that | denotes either types.
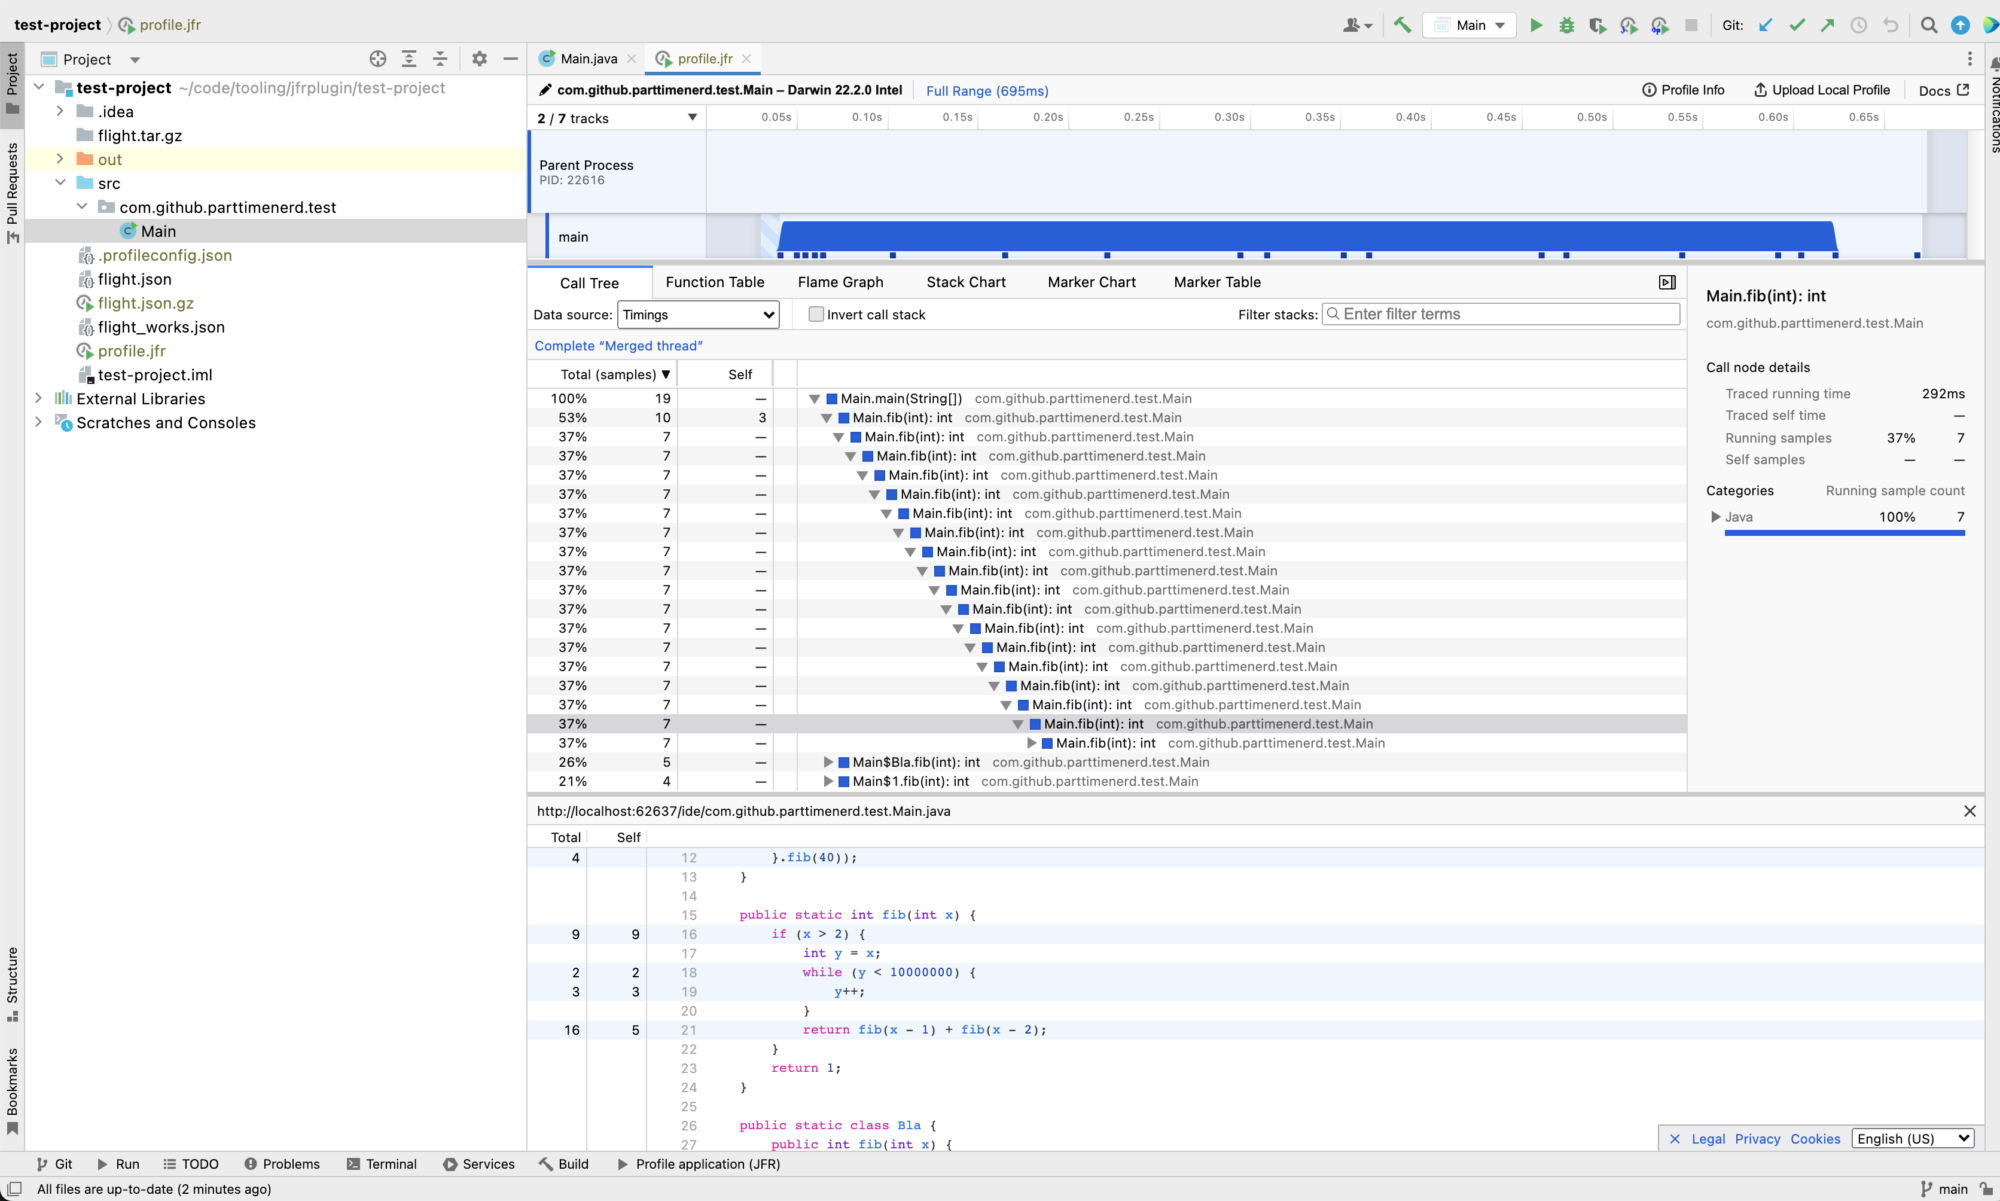
Layout
A short interlude: The layout of Firefox Profiler consists basically of a timeline view and a methods and timing view:

The timeline allows you to select specific threads and a time slice to view the details in the detail section below the timeline.
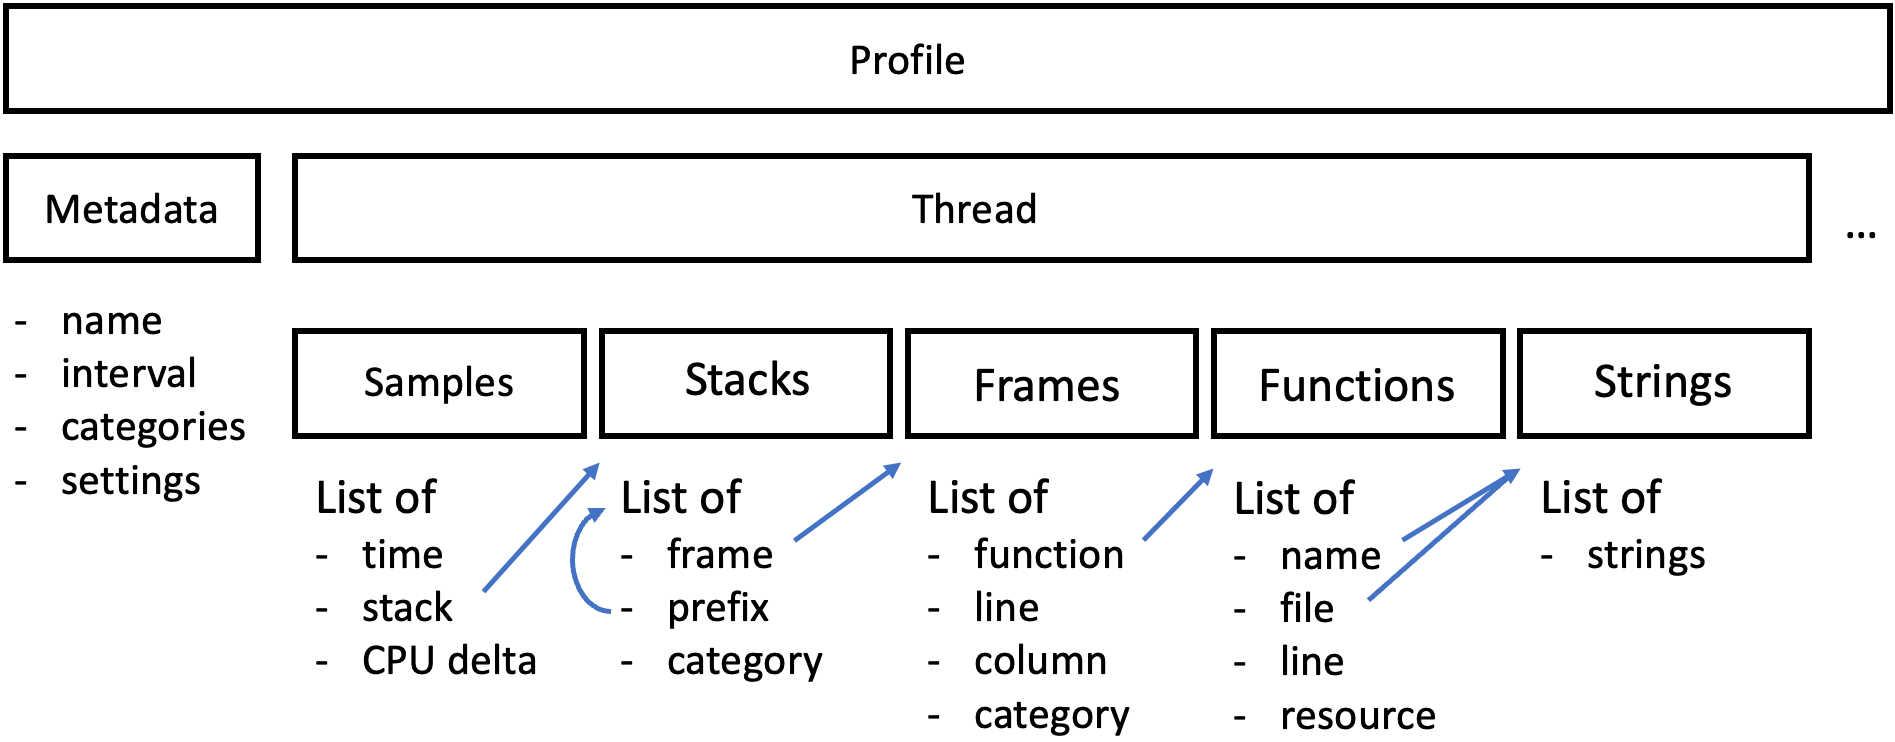
Overview
The following shows the main components of the profile format, omitting and summarizing many properties. This diagram should give a rough overview of what comes next:
Profile
The topmost level of a profile is the Profile type:
type Profile = {|
  meta: ProfileMeta,    // meta information, like application name
  libs: Lib[],          // used shared native libraries
  ...
  counters?: Counter[], // CPU and memory counters
  ...
  threads: Thread[],    // samples per thread
  ...
|};
A profile consists of the metadata, shared libraries, CPU and memory counters, and the rest of the data per thread.
ProfileMeta
A profile can have lots of metadata shown in the UI. The ProfileMeta type specifies this:
type ProfileMeta = {|
  // The interval at which the threads are sampled.
  interval: Milliseconds,
  // The number of milliseconds since midnight January 1, 1970 GMT.
  startTime: Milliseconds,
  // The number of milliseconds since midnight January 1, 1970 GMT.
  endTime?: Milliseconds,
  ...
  // The list of categories as provided by the platform. The categories are present for
  // all Firefox profiles, but imported profiles may not include any category support.
  // The front-end will provide a default list of categories, but the saved profile
  // will not include them.
  categories?: CategoryList,
  // The name of the product, most likely "Firefox".
  product: 'Firefox' | string,
  ...
  // Arguments to the program (currently only used for imported profiles)
  arguments?: string,
  ...
  // The amount of logically available CPU cores for the program.
  logicalCPUs?: number,
  ...
  symbolicated?: boolean,  // usually false for imported profiles
  symbolicationNotSupported?: boolean, // usually true for imported profiles
  // symbolication is usually not important for imported and converted profiles
  ...
  // Profile importers can optionally add information about where they are imported from.
  // They also use the "product" field in the meta information, but this is somewhat
  // ambiguous. This field, if present, is unambiguous that it was imported.
  importedFrom?: string,

  // The following are settings that are used to configure the views for
  // imported profiles, as some features do not make sense for them

  // Do not distinguish between different stack types?
  usesOnlyOneStackType?: boolean, // true in our use case
  // Hide the "implementation" information in the UI (see #3709)?
  doesNotUseFrameImplementation?: boolean, // true in our use case
  // Hide the "Look up the function name on Searchfox" menu entry?
  sourceCodeIsNotOnSearchfox?: boolean,    // true in our use case
  // Indexes of the threads that are initially visible in the UI.
  // This is useful for imported profiles for which the internal visibility score
  // ranking does not make sense.
  initialVisibleThreads?: ThreadIndex[],
  // Indexes of the threads that are initially selected in the UI.
  // This is also most useful for imported profiles where just using the first thread
  // of each process might not make sense.
  initialSelectedThreads?: ThreadIndex[],
  // Keep the defined thread order
  keepProfileThreadOrder?: boolean,
|};
And there is more. It might feel overwhelming, but this data structure also allows you to tailor the profiler UI slightly to your needs.
Category
Many parts of the profile are associated with a Category and a subcategory. A category is defined as:
type Category = {|
  name: string,
  color: string,
  subcategories: string[],
|};
Categories are referenced by their index in the category list of the ProfileMeta data structure and subcategories by their index in the field of their parent category.
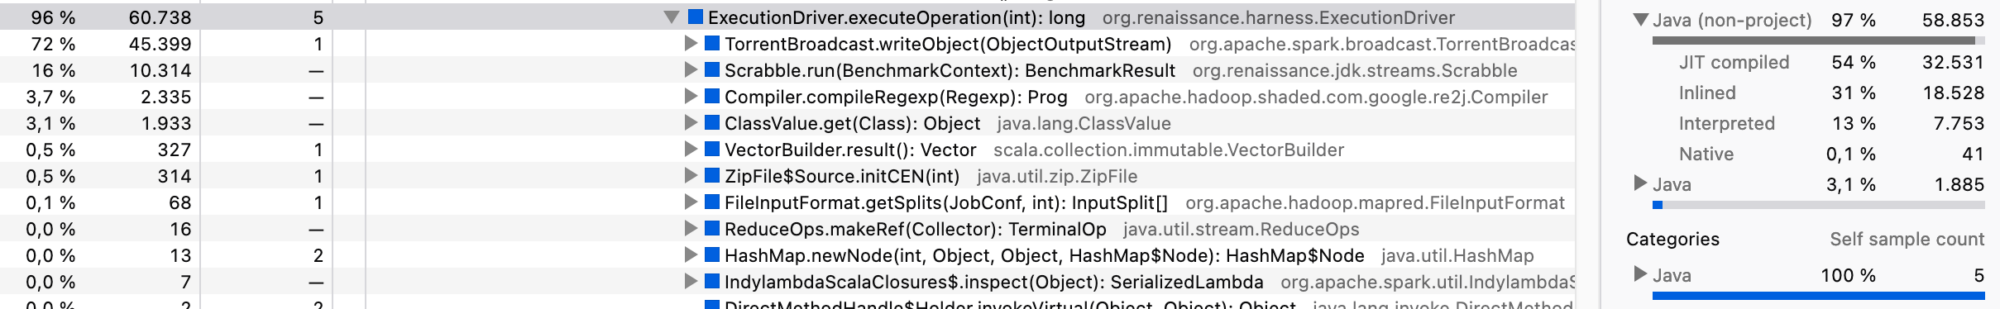
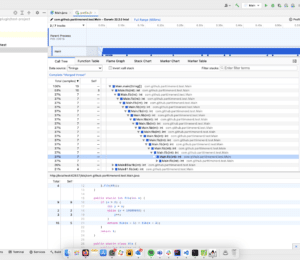
The categories are used to assign a color to the squares in front of the method names and give more information on every call tree node in the sidebar:
Now to the individual threads:
Thread
The thread data structure combines all information related to a single thread. There can be multiple threads per process Id. The thread with the name GeckoMain is handled differently than the others. It is the main thread that is shown in the process timeline.
type Thread = {|
  ...
  processStartupTime: Milliseconds,
  processShutdownTime: Milliseconds | null,
  registerTime: Milliseconds,
  unregisterTime: Milliseconds | null,
  ...
  name: string,
  ...
  pid: Pid,
  tid: Tid,
  ...
  // Strings for profiles are collected into a single table, and are referred to by
  // their index by other tables.
  stringTable: UniqueStringArray,
  ...
  samples: SamplesTable,
  ...
  stackTable: StackTable,
  frameTable: FrameTable,
  funcTable: FuncTable,
  resourceTable: ResourceTable,
  ...
|};
The file format stores all stack traces in a space-efficient format which the front end can handle fast. It uses an array of strings (stringTable) to store all strings that appear in the stack traces (like function names), the other data structures only refer to strings by their index in this array.
SampleS Table
This data structure associates a captured stack with a capture time and an optional weight:
/**
 * The Gecko Profiler records samples of what function was currently being executed, and
 * the callstack that is associated with it. This is done at a fixed but configurable
 * rate, e.g. every 1 millisecond. This table represents the minimal amount of
 * information that is needed to represent that sampled function. Most of the entries
 * are indices into other tables.
 */
type SamplesTable = {|
  ...
  stack: Array<IndexIntoStackTable | null>,
  time: Milliseconds[],
  // An optional weight array. If not present, then the weight is assumed to be 1.
  // See the WeightType type for more information.
  weight: null | number[],
  weightType: WeightType,  // 'samples' or 'tracing-ms'
  // CPU usage value of the current thread. Its values are null only if the back-end
  // fails to get the CPU usage from operating system.
  threadCPUDelta?: Array<number | null>,
  length: number,
|};
Filling this with data from a sampling profiler is easy, just add references to the stacks and their occurrence time. For example consider you sampled the stack A-B at 0 and A-B-C at 2, then the samples table is:
SamplesTable = {
  stack: [A-B, A-B-C], // references into the stack table
  time:  [0, 2],
  weigth: null,
  weigthType: 'samples',
  length: 2
}
Filling the threadCPUDelta property allows you to specify the CPU time a thread has used since the last sample. The Firefox Profiler uses this property to show the CPU usage curves in the timeline:

Stack Table
All stacks are stored in the stack table using a prefix array:
type StackTable = {|
  frame: IndexIntoFrameTable[],
  // Imported profiles may not have categories. In this case fill the array with 0s.
  category: IndexIntoCategoryList[],
  subcategory: IndexIntoSubcategoryListForCategory[],
  prefix: Array<IndexIntoStackTable | null>,
  length: number,
|};
Category and subcategory of a stack n gives information on the whole stack, the frame just on its topmost frame. The prefix denotes the stack related to the second-top-most frame or that this stack only has one frame if null. This allows the efficient storage of stacks.
Now consider our example from before. We could store the stack A-B-C as follows:
StackTable = {
  frame:  [A, B, C], // references into the frame table
  prefix: [1, 2, 0],
  ...
}
Frame Table
The frames themselves are stored in the frame table:
/**
 * Frames contain the context information about the function execution at the moment in
 * time. The caller/callee relationship between frames is defined by the StackTable.
 */
type FrameTable = {|
  // If this is a frame for native code, the address is the address of the frame's
  // assembly instruction,  relative to the native library that contains it.
  address: Array<Address | -1>,

  // The inline depth for this frame. If there is an inline stack at an address,
  // we create multiple frames with the same address, one for each depth.
  // The outermost frame always has depth 0.
  inlineDepth: number[],

  category: (IndexIntoCategoryList | null)[],
  subcategory: (IndexIntoSubcategoryListForCategory | null)[],
  func: IndexIntoFuncTable[],
  ...
  line: (number | null)[],
  column: (number | null)[],
  length: number,
|};
Each frame is related to a function, which is in turn stored in the FuncTable.
Func Table
The function table stores all functions with some metadata:
type FuncTable = {|
  // The function name.
  name: Array<IndexIntoStringTable>,

  // isJS and relevantForJS describe the function type. Non-JavaScript functions
  // can be marked as "relevant for JS" so that for example DOM API label functions
  // will show up in any JavaScript stack views.
  // It may be worth combining these two fields into one:
  // https://github.com/firefox-devtools/profiler/issues/2543
  isJS: Array<boolean>,
  relevantForJS: Array<boolean>,

  // The resource describes "Which bag of code did this function come from?".
  // For JS functions, the resource is of type addon, webhost, otherhost, or url.
  // For native functions, the resource is of type library.
  // For labels and for other unidentified functions, we set the resource to -1.
  resource: Array<IndexIntoResourceTable | -1>,

  // These are non-null for JS functions only. The line and column describe the
  // location of the *start* of the JS function. As for the information about which
  // which lines / columns inside the function were actually hit during execution,
  // that information is stored in the frameTable, not in the funcTable.
  fileName: Array<IndexIntoStringTable | null>,
  lineNumber: Array<number | null>,
  columnNumber: Array<number | null>,

  length: number,
|};
Resource Table
The last table I'll show in this article is the resource table. It depends on you and what you map to it:
/**
 * The ResourceTable holds additional information about functions. It tends to contain
 * sparse arrays. Multiple functions can point to the same resource.
 */
type ResourceTable = {|
  length: number,
  ...
  name: Array<IndexIntoStringTable>,
  ...
  // 0: unknown, library: 1, addon: 2, webhost: 3, otherhost: 4, url: 5
  type: resourceTypeEnum[],
|};
This was quite a technical article, so thanks for reading till the end. I hope it helps you when you try to target the Firefox Profiler, and see you for the next blog post.
This blog post is part of my work in the SapMachine team at SAP, making profiling easier for everyone. This post first appeared on my personal blog.
- February 03, 2023
- 9 min read
A JVM developer working on profilers and their underlying technology, e.g. JEP Candidate 435, in the SapMachine team at SAP.


Comments (0)
No comments yet. Be the first.