

OpenJDK and the Future of Production Profiling
- June 24, 2021
- 9 min read
Some thoughts on the future of continuous production profiling on the OpenJDK platform.
A long time ago, the JRockit Runtime Analyzer (JRA) was introduced into the JRockit JVM as a means of being able to figure out what was going on in the JVM. It was mainly there to find out how customers were using the JVM, so that the JVM could be optimized for actual real-world production work-loads. The JRA output the data as XML, since customers insisted on the data being human readable so that they could see exactly what they would be sending us. Later LAT (LATency Analyzer) was introduced, since after the introduction of the JRockit low latency garbage collector (a.k.a the DetGC), some customers complained about the GC not keeping its latency promises. More often than not, it turned out it was other kinds of thread stalls causing the latencies, so LAT was introduced so that the JRockit team could figure out where the problematic code was. Since there could be a considerable amount of data in LAT, a binary format was introduced for the events recorded.
Eventually the production profiling (JRA + LAT) had a model overhaul and became the JRockit Flight Recorder. The data format was binary, self describing, extensible and efficient. After Oracle acquired Sun Microsystems, and the Hotspot and JRockit JVM teams merged, it became the Java Flight Recorder (JFR), and in 2018 it was open sourced as the JDK Flight Recorder (still JFR), since calling anything related to Java something with “Java” in the name can be complicated.
The JDK Flight Recorder design philosophy is to be the one-stop-shop production profiler for OpenJDK. JFR needs to be able to do various kinds of profiling, all at the same time, at a low overhead. It also needs to be able to run continuously for as long as someone is interested in the data. Potentially always.
Now, with changes in the Java (and the computing) ecosystem, JFR has some loom-ing challenges to remain relevant for the future.
JFR has a lot of nice properties:
- It does multiple kinds of profiling, normally at a low overhead (space and CPU).
(Profiling types include allocation profiling, almost CPU profiling, latency outlier profiling and much more.) - It doesn’t suffer from the same constraints as Java-only based profilers.
(Weaknesses usually include things like safe point bias, safepointing VM operations, allocation pressure, undoing scalarization optimizations, lack of STW/safepoint visibility.) - It provides context helpful to solving problems.
(For example, a monitor enter event has the monitor class, the monitor address, the thread holding the monitor, the thread and stack trace for the blocking call and more.) - It is low overhead, (mostly) designed for predictable data rates and overhead.
- It is extensible – you can add your own profilers and data.
(Datadog, for example, has its own rather useful exception profiler which is publishing data into JFR.) - As long as all your data is produced in JFR, all the common constants in the runtime will be recorded into the same constant pool.
(For example, if you record some data using JFR and some data with a custom agent, common class names, method names etc will need to be repeated in both of the serialization formats.)
There are however a few ways in which JFR can, and probably has to, improve, to remain the ultimate production profiling platform for Java:
- Data rate (and thereby overhead) needs to be more deterministic.
- CPU profiling needs to be improved.
- Wall clock profiling needs to be possible.
- It needs to be possible to easily and cheaply associate context with events.
Let’s take these in reverse order.
Recording Context
A very common problem is to try to associate some contextual information with the data produced by JFR. For example, in the good old Oracle days, there were events produced by WebLogic Server (WLS) containing what was called the Execution Context IDs (ECIDs). Since JFR events are thread local, it was possible to use them to find out what other, lower level, information was captured during that time, for example where the allocation pressure was, or why a call to a logger leading to a blocking call trying to enter a contended monitor happened. The instrumented code, and thereby the events, were usually emitted where something took a bit of time, such as database IO and similar, so the overhead was not bad.
Fast-forward to today. We now have distributed tracers doing pretty much what WLS was doing back in the day. We now have a trace, which is a directed acyclic graph of spans, which we track. The difference being that with the microservices and async frameworks that are commonly in use these days, these spans can now last a very short time. The tracers do keep track of when the context is propagated to other threads; in other words, the tracer can know where work is carried out on specific threads for a specific trace/span. In the end, the tracer doesn’t really care though – it only keeps track of this to know when a span can be closed. No matter how many related little work items were scheduled on various threads, the tracer will simply note when the span was started, and when the span was closed. For the profiler, however, the information about which thread did work related to a specific span is crucial to be able to figure out what traces were captured in the context of what spans/traces. Since a thread can switch between doing work for different spans at an incredible rate, the overhead of using additional events to keep track of them can be quite costly. Especially if the switches happen way more often than a sample is being captured.
This will only be compounded once Loom becomes part of the Java platform, and we can have millions of Virtual Threads (fibers, p-threads, MxN threads, green threads, whatever you want to call them) running.
A long time ago, the JFR team was discussing something we called thread coloring – the ability to tell a thread what the current context is. This is exactly what Go does today with goroutines. In Go it is called profiling labels. Go pre-aggregates the CPU profiling data, but allows the settings of labels to group the profiling data into buckets. Sadly, in Go it is currently limited to CPU-profiling only.
One solution to the context problem could be to allow setting the context for a thread – conceptually a Map, and to provide some new settings for an event, for example record-context, to decide if the context should be recorded into the event or if we don’t care, and record-only-on-context, to decide to record an event only if there is some context present.
Having such a capability would not only make it possible to associate events with a context even where such a context changes rapidly. It could also be used to only record certain events when they occur in a context for which we care, possibly bringing down the overhead of capturing data and stack-traces, and saving memory in the buffers for the things we find to be the most relevant. A concrete example would be to only record certain information if a thread is currently associated with a trace which will be sampled.
See https://bugs.openjdk.java.net/browse/JDK-8264516.
Wall-Clock Profiling Must Be Possible
JFR has an interesting mix of sampling profiling, thresholded execution tracing and metrics. For example, it has a sampling execution profiler, a rate-limited sampling allocation profiler etc. It also has events to locate thread latency outliers. These events are not sampled, but give you exact information about a thread halt lasting longer than a configurable threshold.
Of course, one problem with thresholding is that you can theoretically have a lot of thread latencies just below the threshold. It is easy to construct an artificial benchmark where the data indicates that you have no thread latencies whilst having nothing but thread latencies.
One way to get unbiased information, at a reasonable cost (i.e. not setting the threshold to 0 for the latency outlier events), is to introduce a wall clock profiler. A wall clock profiler basically periodically dumps the thread stack for a thread, no matter what it is up to. A limitation is that the wall clock profiler has no idea of what the thread was actually up to – we can’t get all the juicy, custom, actionable, information at that point – we usually only get the thread dump.
Also, given that you might have millions of (virtual) threads, you probably don’t want to sample them all at any given time, and you certainly don’t want to stop the world whilst doing the sampling. As a matter of fact, for most applications, looking at wall clock profiling information from all threads will be a very boring exercise – most of them will be halted waiting for something to do, for example in thread pools, or waiting in some I/O. For example, for your average Java recording, you will have plenty of threads in thread pools, being parked. To see that you have thousands of threads waiting on a park call in a thread pool will not help you resolve a great many problems. If you, on the other hand, have a really long park causing a trace to take a really long time to complete, then you’ll likely be interested in what is going on.
This means that different profilers probably want these wall-clock samples to be picked differently. One way to accomplish this would be to allow users of JFR to commit events on a separate thread.
Event#commit(Thread)
This would allow someone to build a profiler by simply periodically committing events on the threads it currently cares about. It would also allow building other kinds of profilers and sampling behaviours.
Another way of accomplishing this would be to add an annotation to override default stuff captured by JFR in an event.
class MyEvent extends Event {

    @overridejfr
    Thread overrideThread;
}
An advantage with this variant is that you could potentially add more override behaviours that are handled by JFR over time.
A third variant might be to introduce a configurable global wall clock event, perhaps one that picks one thread at a time in a round robin fashion, at a certain frequency. Together with the context feature mentioned above, it would be possible to only emit events where there is useful context available.
Yet another variant may be to add a native function (extern “C”) to emit an event. Something similar to AsyncGetCallTrace (probably implemented using AsyncGetCallTrace), but which emits an event. If we have the context feature described above, it could be used to decide where events are emitted. If different kinds of profiling will be implemented, you can simply provide context information about the kind of profiling being done to avoid the profilers interfering with each other.
There is JDK-8237206 for this, but there isn’t much information recorded in the issue.
CPU Profiling Improved
The current way of doing CPU profiling with JFR is to use the Execution Sample Event in JFR. It gives you a good idea of where the JVM is spending the most CPU time executing Java code. It is cheap, has low overhead, and satisfies the needs of many users.
That said, there are some problems. One is that it does not cover the full Java process. If there is a native library running native threads, the CPU time spent there won’t be accounted for. Also, some other native and intrinsified code, for example the JVM native threads, will not be covered. It is easy to write a benchmark where JFR will capture almost no samples at all.
To get a better understanding of where the CPU is being spent, we need to build a profiler actually sampling on CPU time, and that can, at least optionally, capture the full thread stacks including native frames. One approach to this is to do what async profiler does – use kernel profiling data and line it up with information from AsyncGetCallTrace.
At Datadog we’ve built a pretty awesome CPU profiler for Linux, based around perf_event_open – one that does really well, and which handles symbol resolution in containerized environments better than most. Sadly, we don’t have it for Windows and Mac, so, if we contribute it to OpenJDK, we would need help implementing it on other platforms.
There is JDK-8234854, but I haven’t added much context yet.
Deterministic Overhead and Memory Use
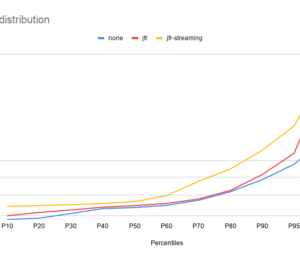
One problem that JFR used to have, before JDK 16, was that allocation profiling could get very expensive. Especially for allocation heavy applications, running on plenty of CPUs. It could get very expensive both in terms of overhead but also in terms of size. For example, running a well parallelized, allocation heavy, application on a 96 core machine could produce millions of events per minute, resulting in recording sizes of hundreds of megabytes per minute.
In JDK 16 Datadog submitted a new kind of allocation profiler, which was rate limited. It drew inspiration from PID controllers (yes, I still love robotics, even though there is literally no time for it these days) to let the user specify a budget of the maximum number of events per second, and then the controller will attempt to keep the number of events emitted to that budget, subsampling if necessary.
We had already used the same technique successfully for our exception profiler, since it turns out that some people use not only exceptions, but even subclasses of Error (!), for flow control.
Now, it may be useful to use the same kind, or some similar kind, of safety valve to limit both the overhead and the data production rate for other events that are prone to the same edge cases. For example, the thread latency events today are currently thresholded. This means that you perhaps, given the number of threads, might be able to estimate the maximum number of events you could produce. But it’s not very helpful, since you might be running very few, or, in the future, with Loom, millions of them.
Instead you might want to subsample them, at a max rate that you can set yourself, per event type. You could even allow for thresholding and rate limited sampling at the same time, accepting a certain bias, e.g. if you want to focus on longer lasting thread halts.
Summary
TL;DR, JFR has some interesting challenges ahead. Some of them will be compounded by the introduction of Virtual Threads. For JFR to remain the premium, best in class, production profiling platform, some investment will be needed. Datadog will try to help, but some of these problems will require updates to the JFR file format and updating the API. The OpenJDK community will need to be involved.
As published on hirt.se on May 31st, 2021
- June 24, 2021
- 9 min read
Marcus is the project lead for the Open JDK JMC project. Once upon a time he co-founded Appeal, the company creating the JRockit JVM.


Comments (1)
Anbu
5 years agoNice article. Learnt lot of things.