

Performance of Modern Java on Data-Heavy Workloads: Batch Processing
- June 09, 2020
- 7 min read
This post is a part of a series:
- Part 1 (Intro and high-throughput streaming benchmark)
- Part 2 (you are here)
- Part 3 (low-latency benchmark)
- Part 4 (concurrent GC with green threads)
- Part 5 (billion events per second)
Batch Pipeline Benchmark
A batch pipeline processes a finite amount of stored data. There are no running results, we need the output of the aggregate function applied to the entire dataset. This changes our performance requirements: the key factor in streaming, latency, doesn't exist here since we are not processing data in real time. The only metric that matters is the total run time of the pipeline.
For this reason, we considered the Parallel GC as a relevant candidate. In the first testing round, on a single node, it actually delivered the best throughput (but only after GC tuning). However, it achieves that throughput at the expense of GC pause duration. In a cluster, whenever any node enters a GC pause, it stalls the whole data pipeline. Since individual nodes enter GC pauses at different times, the amount of time spent in GC goes up with every node you add to the cluster. We explored this effect by comparing single-node tests with tests in a three-node cluster.
On the flip side, we did not consider the experimental low-latency collectors in this round since their very short GC pauses have no effect on the test result, and they achieve them at the expense of throughput.
Single-Node Benchmark: The Pipeline
For the single-node batch benchmark we used this simple pipeline, full code on GitHub:
p.readFrom(longSource)
 .rebalance() // Introduced in Jet 4.2
 .groupingKey(n -> n % NUM_KEYS)
 .aggregate(summingLong(n -> n))
 .filter(e -> (e.getKey() & 0xFF_FFFFL) == 0)
 .writeTo(Sinks.logger())
The source is again a self-contained mock source that just emits a sequence of long numbers and the key function is defined so that the grouping key cycles through the key space: 0, 1, 2, ..., NUM_KEYS, 0, 1, 2, ... This means that, over the first cycle, the pipeline observes all the keys and builds up a fixed data structure to hold the aggregation results. Over the following cycles it just updates the existing data. This aligns perfectly with the Generational Garbage Hypothesis: the objects either last through the entire computation or are short-lived temporary objects that become garbage very soon after creation.
We let our source emit 400 million items and had 100 million distinct keys, so we cycled four times over the same keys.
The .rebalance() operator changes Jet's default two-stage aggregation to single-stage. It exhibited more predictable behavior in our benchmark.
We also tested a variant where the aggregate operation uses a boxed Long instance as state, producing garbage every time the running score is updated. In this case many objects die after having spent substantial time in the old generation. For this variant we had to reduce the number of keys to 70 million, with 100 million the GC pressure was too high.
For the batch pipeline we didn't focus on the low-latency collectors since they have nothing to offer in this case. Also, because we saw earlier that JDK 14 performs much the same as JDK 11, we just ran one test to confirm it, but otherwise focused on JDK 8 vs. JDK 11 and compared the JDK 8 default Parallel collector with G1.
Single-Node Benchmark: The Results
For single-node testing, we ran the benchmark on a laptop with 16 GB RAM and a 6-core Intel Core i7. We used a heap size of 10 GB.
Initially we got very bad performance out of the Parallel collector and had to resort to GC tuning. For this purpose we highly recommend using VisualVM and its Visual GC plugin. When you set the frame rate to the highest setting (10 FPS), you can enjoy a very fine-grained visual insight into how the interplay between your application's allocation and the GC works out. By watching these live animations for a while, we realized that the main issue was a too large slice of RAM given to the new generation. By default the ratio between Old and New generations is just 2:1, and it is not dynamically adaptable at runtime. Based on this we decided to try with -XX:NewRatio=8 and it completely changed the picture. Now Parallel was turning in the best times overall. We also used -XX:MaxTenuringThreshold=2 to reduce the copying of data between the Survivor spaces, since in the pipeline the temporary objects die pretty soon.
Now, on to the results. The only relevant metric in this batch pipeline benchmark is the time for the job to complete. To visualize the results we took the reciprocal of that, so the charts show throughput in items per second. Here are our results on a single node:
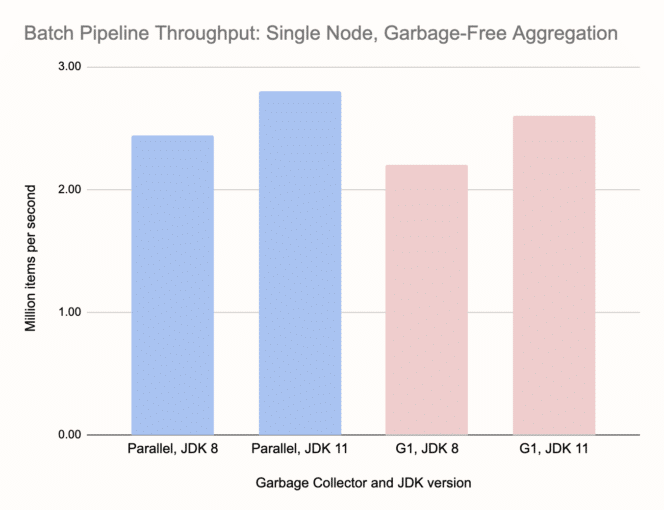
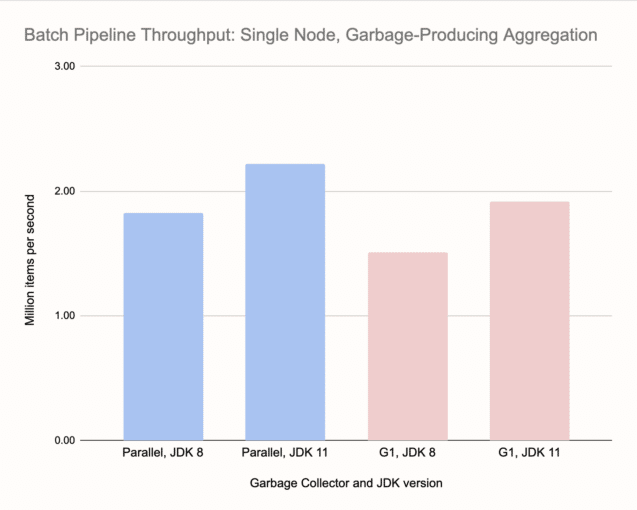
Comparing the two charts we can see that garbage-free aggregation gave a throughput boost of around 30-35%, and that's despite the larger keyset we used for it. G1 on JDK 8 was the worst performer and the fine-tuned Parallel on JDK 11 was the best. G1 on JDK 11 wasn't far behind. Note that we didn't have to touch anything in the configuration of G1, which is an important fact. GC tuning is highly case-specific, the results may dramatically change with e.g., more data, and it must be applied to the entire cluster, making it specifically tuned for one kind of workload.
Here's the performance of the default Parallel GC compared to the tuned version we used for testing:
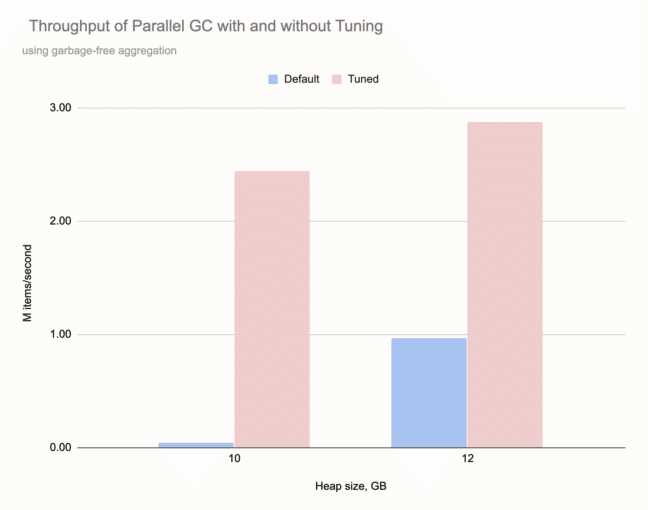
With 10 GB of heap it failed completely, stuck in back-to-back Full GC operations each taking about 7 seconds. With more heap it managed to make some progress, but was still hampered with very frequent Full GCs. Note that we got the above results for the most favorable case, with garbage-free aggregation.
Three-Node Cluster Benchmark: The Pipeline
To properly benchmark in the cluster, we had to use a bit more complex pipeline:
p.readFrom(longSource())
 .rebalance()
 .flatMap(n -> {
     Long[] items = new Long[SOURCE_STEP];
     Arrays.setAll(items, i -> n + i);
     return traverseArray(items);
 })
 .rebalance()
 .groupingKey(n -> n % NUM_KEYS)
 .aggregate(AggregateOperations.summingLong(n -> n))
 .filter(e -> e.getKey() % 1_000_000 == 0)
 .writeTo(Sinks.logger())
;
Since the source is non-parallel, we applied some optimizations so it doesn't become a bottleneck. We let the source emit the numbers 0, 10, 20, ... and then applied a parallelized flatMap stage that interpolates the missing numbers. We also used rebalance() between the source and flatMap, spreading the data across the cluster. We applied rebalancing again before entering the main stage, keyed aggregation. After the aggregation stage we first reduce the output to every millionth key-value pair and then send it to the logger. We used one billion data items and a keyset of half a billion.
Same as on single-node, we tested both this pipeline, with a garbage-free aggregation, and a modified one with garbage-producing aggregation.
Three-Node Cluster Benchmark: The Results
We performed this benchmark on an AWS cluster of three c5d.4xlarge instances. They have 16 virtualized CPU cores and 32 GB of RAM. The network is 10 Gbit/s. Here are the results:
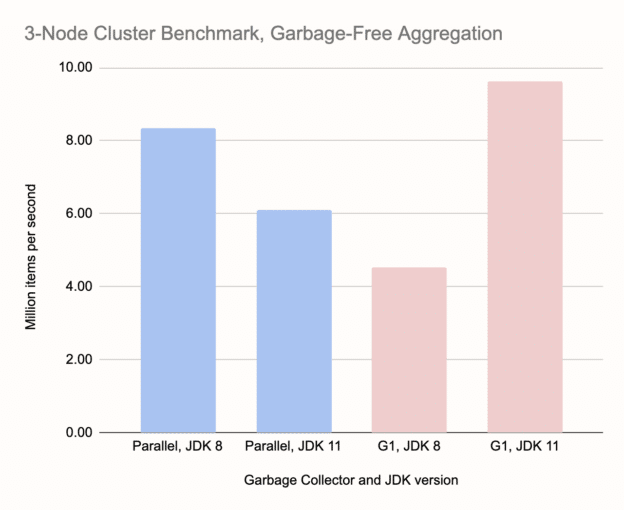
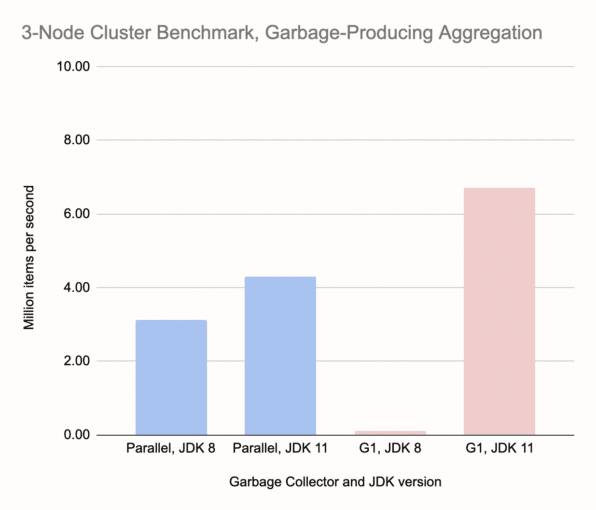
In passing, let's note the overall increase in throughput compared to single-node benchmarks, about three times. That's the advantage of distributed processing. As for collectors, G1 on JDK 11 is the clear winner in both tests. Another striking result is the almost nonexistent bar for G1 on JDK 8, however there's a deeper story here that affects other measurements as well, for example the apparent advantage of Parallel GC on JDK 8 vs. JDK 11. It has to do with the effect we noted at the outset: a GC pause on any one member halts the processing on the entire cluster. G1 on JDK 8 enters very long GC pauses, more than a minute. This is enough to trigger the cluster's failure detector and consider the node dead. The job fails, the cluster reshapes itself, and then the job restarts on just two nodes. This, naturally, fails even sooner because there's more data on each member. In the meantime the kicked-out node has rejoined, so the job restarts on two nodes again, but different ones. We end up in an endless loop of job restarts.
The Parallel collector's GC pauses stopped short of bringing down the cluster, but it fared significantly worse than in single-node tests. Here it was 30% behind the G1 on JDK 11. With a bigger cluster this would get even worse.
Compared to all other tests, it is surprising to see Parallel on JDK 8 win over JDK 11, however this is due to a very lucky coincidence that, in those particular test runs, the Full GC pauses got synchronized on all nodes, parallelizing the effort of the GC. Clearly, this is not a reliable effect.
Even though in the particular benchmark setup which we report here, we didn't observe the catastrophic consequence of long GC pauses on cluster stability while using the Parallel collector, it is more of a chance outcome. In other tests, where we used a larger heap and more data, or the same heap but with less headroom left, the Parallel collector did cause the same damage. However, even when it doesn't cause outright failure, the charts show the advantage it had on a single node has disappeared. You can expect the results to get worse with each further node you add to the cluster.
The JDK 11 G1 collector, on the other hand, was producing GC pauses of a sufficiently short duration that the rest of the pipeline didn't get stalled. The pipeline has mechanisms that dampen out short hiccups and as long as the GC pauses are within acceptable limits (up to some 150 ms), the effect of GC stays local.
If you enjoyed reading this post, check out Jet at GitHub and give us a star!
- June 09, 2020
- 7 min read
Marko Topolnik, PhD, has been a Java professional since 2001. His current position is in the core team of Hazelcast Jet, where he co-wrote the core execution engine based on coroutine-like suspendable code that runs many concurrent tasks on a fixed thread pool. Marko is also an active contributor on Stack Overflow on the kotlin-coroutines tag.


Comments (0)
No comments yet. Be the first.