

Spring Boot Debugging with Aspect-Oriented Programming (AOP)
- May 05, 2023
- 5 min read
Aspect-Oriented Programming (AOP) is a programming paradigm that aims to increase modularity by allowing the separation of cross-cutting concerns.
In simple terms, it helps you keep your code clean, modular, and easy to maintain.
We can leverage AOP to debug Spring Boot applications more effectively and seamlessly.
In this post, we will explore how to use AOP to debug a Spring Boot application effectively.
AOP Concepts
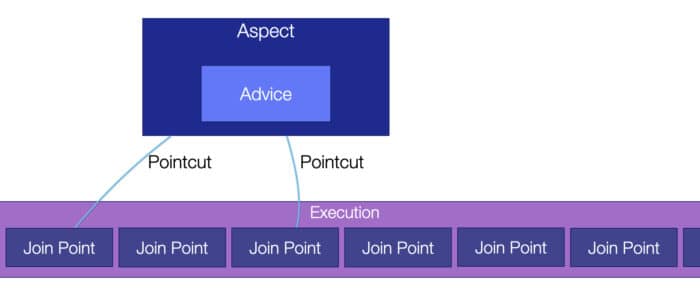
Before diving into debugging with AOP, it is essential to understand the core concepts. AOP lets us write code that executes before or after a method. It includes the following common terms:
- Aspect: An aspect represents the cross-cutting concerns or the functionality that needs to be applied throughout the application.
- Join Point: A join point is a specific point in the execution flow of the application, where an aspect can be applied.
- Advice: The action taken by an aspect at a specific join point is called advice. There are different types of advice, such as before, after, around, and after throwing.
- Pointcut: A pointcut is a set of join points where an aspect should be applied.
I will skip the discussion on weaving since there’s a lot of nuance related to that and I want to focus on the debugging aspects. I don't want to make this into an AOP tutorial. However, there’s one general aspect of AOP I want to discuss.
While AOP offers significant benefits in terms of modularity, maintainability, and debugging capabilities, it's important to be aware of the potential performance implications.
Using AOP can introduce some overhead, primarily due to the creation and execution of proxy objects, which intercept method calls and apply the specified advices. The impact on performance can vary depending on the number of aspects, the complexity of pointcut expressions, and the type of advice used. For example, around advice is typically more expensive in terms of performance compared to before and after advice.
To minimize the performance impact of AOP, consider the following best practices:
- Be selective: Apply AOP to the critical parts of your application where it provides the most value. Avoid using aspects for trivial or infrequent operations.
- Optimize pointcut expressions: Ensure that your pointcut expressions are as precise as possible. This can help minimize the number of unnecessary interceptions and reduce the overhead.
- Limit advice execution: Choose the appropriate type of advice for your use case. For example, use before or after advice instead of around advice when possible.
- Use conditional aspects: If some aspects are only required for debugging or development purposes, use conditional aspects that can be enabled or disabled based on a configuration property. This ensures that the performance impact is limited to specific environments or scenarios.
- Monitor and measure: Regularly monitor and measure the performance of your application to ensure that the overhead introduced by AOP is within acceptable limits. Use profiling tools to identify potential bottlenecks and optimize your AOP implementation accordingly.
Logging Aspect
Let's create a simple aspect to log the execution time of methods in our Spring Boot application. This can help identify performance bottlenecks.
We can create a new class called 'LoggingAspect' and annotate it with @Aspect and @Component to indicate that it's an aspect and a Spring-managed bean. We implement a pointcut expression to target the methods you want to measure. For example, you can target all public methods in a specific package. We then implement an around advice to measure the execution time and log the results.
Here's an example of a LoggingAspect:
@Aspect
@Component
public class LoggingAspect {
  private static final Logger logger = LoggerFactory.getLogger(LoggingAspect.class);

  @Pointcut("execution(public * com.example.myapp..*.*(..))")
  public void publicMethods() {}

  @Around("publicMethods()")
  public Object logExecutionTime(ProceedingJoinPoint joinPoint) throws Throwable {
    long startTime = System.currentTimeMillis();

    Object result = joinPoint.proceed();

    long elapsedTime = System.currentTimeMillis() - startTime;
    logger.debug("Method [{}] executed in {} ms", joinPoint.getSignature(), elapsedTime);
    return result;
  }
}
Pointcut methods are empty because their sole purpose is to define a pointcut expression, which determines the join points (i.e., specific points in the execution of a program) where the aspect should be applied. The method body itself does not contain any logic, as the behavior of the aspect is defined in the advice methods (e.g., @Before, @After, @Around, etc.).
The pointcut method serves as a reusable reference to a specific pointcut expression, making it easier to maintain and update if needed. By referring to a pointcut method in your advice methods, you can apply the same pointcut expression to multiple pieces of advice without duplicating the expression. We will see that in action below.
After implementing the LoggingAspect, we can run our application and observe the logs. We should now see the execution time for each targeted method as a poor man's profiler. Just like a regular profiler, this tool has many disadvantages and impacts the observed application. However, we can extract valuable data if we tune this correctly.
Logging All Methods
One of the common problems we face in big projects is flaky tests and failures. These are especially hard to understand as we might not have enough logging data.
Adding logs to the entire application is impractical in most cases and we’d only want such logs for specific CI executions. We wouldn’t want to over-log in production or even maintain such logging code. However, knowing the parameters that every method received and its return value can lead us to understand a failure after the fact.
The following code shows such a logger that can print out every entry/exit and the arguments or return values:
@Aspect
@Component
public class LoggingAspect {
    private static final Logger logger = LoggerFactory.getLogger(LoggingAspect.class);

    @Pointcut("execution(public * com.example.myapp..*.*(..))")
    public void publicMethods() {}

    @Around("publicMethods()")
    public Object logMethodEntryAndExit(ProceedingJoinPoint joinPoint) throws Throwable {
        // Log method entry and arguments
        Object[] args = joinPoint.getArgs();

        logger.debug("Entering method [{}] with arguments: {}", joinPoint.getSignature(), Arrays.toString(args));

        // Execute the target method and capture the return value
        Object result = joinPoint.proceed();

        // Log method exit and return value
        logger.debug("Exiting method [{}] with result: {}", joinPoint.getSignature(), result);

        // Return the result
        return result;
    }
}
The Tip of the Iceberg
Logging to keep track of performance or method entry/exit is powerful but basic. We can go much deeper than that. We can create an aspect to log incoming HTTP requests and responses. This aspect intercepts the methods with the @RequestMapping annotation, which is typically used for handling HTTP requests in Spring Boot applications:
@Aspect
@Component
public class RequestResponseLoggingAspect {
    private static final Logger logger = LoggerFactory.getLogger(RequestResponseLoggingAspect.class);

    @Pointcut("@annotation(org.springframework.web.bind.annotation.RequestMapping)")
    public void requestMappingMethods() {}

    @Around("requestMappingMethods()")
    public Object logRequestAndResponse(ProceedingJoinPoint joinPoint) throws Throwable {
        HttpServletRequest request = ((ServletRequestAttributes) RequestContextHolder.currentRequestAttributes()).getRequest();
        logger.debug("Request: {} {} - Parameters: {}", request.getMethod(), request.getRequestURI(), request.getParameterMap());
        Object result = joinPoint.proceed();
        if (result instanceof ResponseEntity) {
            ResponseEntity<?> responseEntity = (ResponseEntity<?>) result;
            logger.debug("Response: Status {} - Body: {}", responseEntity.getStatusCode(), responseEntity.getBody());
        }
        return result;
    }
}
Another important aspect is bean creation and destruction. We can create an aspect to log these events. This aspect intercepts the methods annotated with @PostConstruct and @PreDestroy which doesn’t apply to all beans but would help us keep track of the applicable code in a large application:
@Aspect
@Component
public class BeanLifecycleLoggingAspect {
    private static final Logger logger = LoggerFactory.getLogger(BeanLifecycleLoggingAspect.class);

    @Pointcut("@annotation(javax.annotation.PostConstruct)")
    public void postConstructMethods() {}

    @Pointcut("@annotation(javax.annotation.PreDestroy)")
    public void preDestroyMethods() {}

    @After("postConstructMethods()")
    public void logBeanInitialization(JoinPoint joinPoint) {
        logger.debug("Bean Initialized: {}", joinPoint.getTarget().getClass().getSimpleName());
    }

    @Before("preDestroyMethods()")
    public void logBeanDestruction(JoinPoint joinPoint) {
        logger.debug("Bean Destroyed: {}", joinPoint.getTarget().getClass().getSimpleName());
    }
}
We can even log dependency injection events. This aspect intercepts the methods with the @Autowired annotation. It doesn’t track constructor injection though but we can use it to track the instance type that gets injected into a bean:
@Aspect
@Component
public class DependencyInjectionLoggingAspect {
    private static final Logger logger = LoggerFactory.getLogger(DependencyInjectionLoggingAspect.class);
   @Pointcut("@annotation(org.springframework.beans.factory.annotation.Autowired)")
    public void autowiredMethods() {}

    @Before("autowiredMethods()")
    public void logDependencyInjection(JoinPoint joinPoint) {
        logger.debug("Autowired: {} - Target: {}", joinPoint.getSignature(), joinPoint.getTarget().getClass().getSimpleName());
    }
}
Final Word
AOP is a fantastic debugging tool.
In this article, I've skimmed a lot of big ideas and overused logging.
When tracking performance a better approach would be to accumulate values and then log the statistics in the end, thus removing the overhead of the logger (which impacts the results).
The one thing I recommend is turning this off by default.
It’s important to run a CI cycle without AOP, the cost is too big and we can seriously impact the final result.
We need to turn this on surgically when we need to understand something deep.
In those situations, AOP tooling can make the difference when searching for that needle in the haystack.
- May 05, 2023
- 5 min read
Author, DevRel, Blogger, Open Source Hacker, Java Rockstar, Conference Speaker, Instructor and Entrepreneur.


Comments (0)
No comments yet. Be the first.