


Why Mirroring Production in Dev Helps You Avoid Costly Mistakes
- July 28, 2025
- 9 min read
Many developers start building their applications with MongoDB using a free M0 cluster or a local environment. While this is common and convenient, it can lead to issues that could easily be avoided by using a more robust setup, such as a development cluster that closely mirrors production. Problems like inefficient queries, missing indexes, or even costly mistakes often go unnoticed in limited environments like M0 or local setups.
In this article, we’ll explore why your development environment should closely reflect your production environment, and how using an M10+ cluster with tools like Query Profiler and Performance Advisor can help you catch performance issues early and build with confidence.
To demonstrate this, we’ve built a small Java application that simulates a real-world scenario where the application needs to retrieve movie details, including the title, full plot, and their semantic vector representation, by combining data across collections using a multi-stage aggregation pipeline. We'll use it to show how MongoDB Atlas tools can uncover problems that might go unnoticed, until they impact production.
The setup: A realistic aggregation scenario
Let’s imagine your team is working on a new feature that queries movie data with some filtering and enrichment logic. The goal is to retrieve movie details, such as the title and full plot, and enrich them with vector embeddings stored in a related collection.
To represent this scenario, we built an aggregation query that joins the movies collection with embedded_movies to fetch embeddings, filters for records where the full plot mentions the word “snow,” and returns a projection with selected fields like title, year, fullplot, and the retrieved plot_embedding:
db.movies.aggregate([
 {
   $lookup: {
     from: "embedded_movies",
     localField: "title",
     foreignField: "title",
     as: "result"
   }
 },
 {
   $match: {
     fullplot: {
       $regex: "snow",
       $options: "i"
     }
   }
 },
 {
   $project: {
     title: 1,
     year: 1,
     fullplot: 1,
     plot_embedding: "$result.plot_embedding"
   }
 },
 {
   $sort: {
     year: -1
   }
 }
])
While this query works correctly, it's intentionally inefficient, designed to simulate a pattern that seems harmless in small datasets but can quickly become problematic as data grows. It includes multiple stages that increase resource usage and complexity, helping us observe how different environments respond under pressure.
One key detail is the use of a $regex filter on the fullplot field, a choice that can lead to slower performance in larger datasets. Although a more efficient solution would be to use MongoDB Atlas Search, we intentionally avoided it here. The goal is to highlight performance pitfalls that developers might face when relying on basic queries without deeper optimization.
The application behind the test
To turn this into a more practical scenario, we created a small Java application with an HTTP endpoint /enriched-details that triggers a method called getMovies. This endpoint executes the same aggregation we discussed earlier, allowing us to simulate how a real application would interact with the database and measure how long the query takes to run.
@GetMapping("/enriched-details")
public ResponseEntity<List<Document>> search(
      @RequestParam String plot
) {
   return ResponseEntity.ok(movieService.getMovies(plot));
}
The controller delegates to a service method where the aggregation is executed. The execution time is logged to help evaluate the impact of this query under different environments:
public List<Document> getMovies(String plot) {
   var start = System.currentTimeMillis();
   MongoCollection<Document> collection = mongoDatabase.getCollection("movies");


   ArrayList<Document> result = collection.aggregate(List.of(
         new Document("$lookup", new Document("from", "embedded_movies")
               .append("localField", "title")
               .append("foreignField", "title")
               .append("as", "result")),
         new Document("$match", new Document("fullplot", new Document("$regex", plot).append("$options", "i"))),
         new Document("$project", new Document("title", 1)
               .append("year", 1)
               .append("fullplot", 1)
               .append("plot_embedding", "$result.plot_embedding")),
         new Document("$sort", new Document("year", -1))
   )).into(new ArrayList<>());


   long duration = System.currentTimeMillis() - start;
   logger.info("Duration: {} ms", duration);
   return result;
}
Additionally, we implemented another endpoint that performs a simpler query by title and year. It helps us later demonstrate how even basic queries can benefit from proper indexing, especially in larger datasets:
@GetMapping("/by-title-year")
public ResponseEntity<List<Document>> findByTitleAndYear(
      @RequestParam String title,
      @RequestParam int year
) {
   return ResponseEntity.ok(movieService.findByTitleAndYear(title, year));
}
And then, the service code that performs the search:
public List<Document> findByTitleAndYear(String title, int year) {
   return getMoviesCollection()
         .find(new Document("title", title).append("year", year))
         .into(new ArrayList<>());
}
This simple setup makes it easy to test different queries in a controlled way, including both the aggregation with $lookup and the direct find by title and year.
The full source code is available on GitHub.
Testing on M0: The hidden risk
When tested against an M0 cluster, the application behaves normally. The response returns without errors, latency is acceptable, and from the app’s perspective, everything looks fine.
To try it yourself, first make sure to run the application and ensure your database contains the sample_mflix dataset (available in MongoDB Atlas as a preloaded sample dataset you can import with one click). Then, point the application to an M0 cluster using your connection string and call the following endpoints:
### Enriched movie details
GET http://localhost:8080/movies/enriched-details?plot=love

### Find movie by title and year
GET http://localhost:8080/movies/by-title-year?title=Titanic&year=1903
Technically speaking, both queries execute relatively fast,mainly because the dataset is still small. But, here's the catch:
- M0 clusters have a 512MB storage limit, which directly impacts the amount of data we’re querying.
In our test environment: The M0 cluster contains just over 21,000 movie documents, staying well within the size limit. Because the M0 dataset is small, this complex aggregation runs fast enough to appear "safe." This gives a false sense of performance stability.
Now, you might be wondering: “How much data do I actually need to get meaningful test results?”
While there's no magic number, testing on a nearly empty database won't reveal much. As a practical rule of thumb, try to load at least 1-10% of your real dataset, or somewhere around 1GB or more, depending on your workload.
M0 clusters, with their 512MB cap, are perfect to get started. But, once your app is doing real work, you'll need more space and more visibility to catch what actually matters.
Taking it to production: Same query, different outcome
Let’s continue our scenario by imagining that the application has now been deployed to production. To simulate this environment more accurately, where the dataset is significantly larger and where most applications typically run on more powerful clusters, the application was moved to an M10 cluster.
Instead of the 21,000 movie documents we had on M0, the M10 environment now holds over 520,000 documents, which is more than 20x the original volume.
The exact same endpoints were executed, but this time, performance issues quickly surfaced. Latency increased, and response times became inconsistent.
What could be causing this? One of the first clues is the significant difference in data volume. With over 520,000 documents, the M10 cluster is processing far more data than the M0 environment, which naturally increases the query’s cost.
Real-time metrics: Detecting the bottleneck
To better understand the system’s behavior, the /movies/enriched-details endpoint was executed again, but this time, with MongoDB Atlas's Real-Time Performance panel open. That’s when a red flag appeared: CPU usage spiked to 100% during the request.
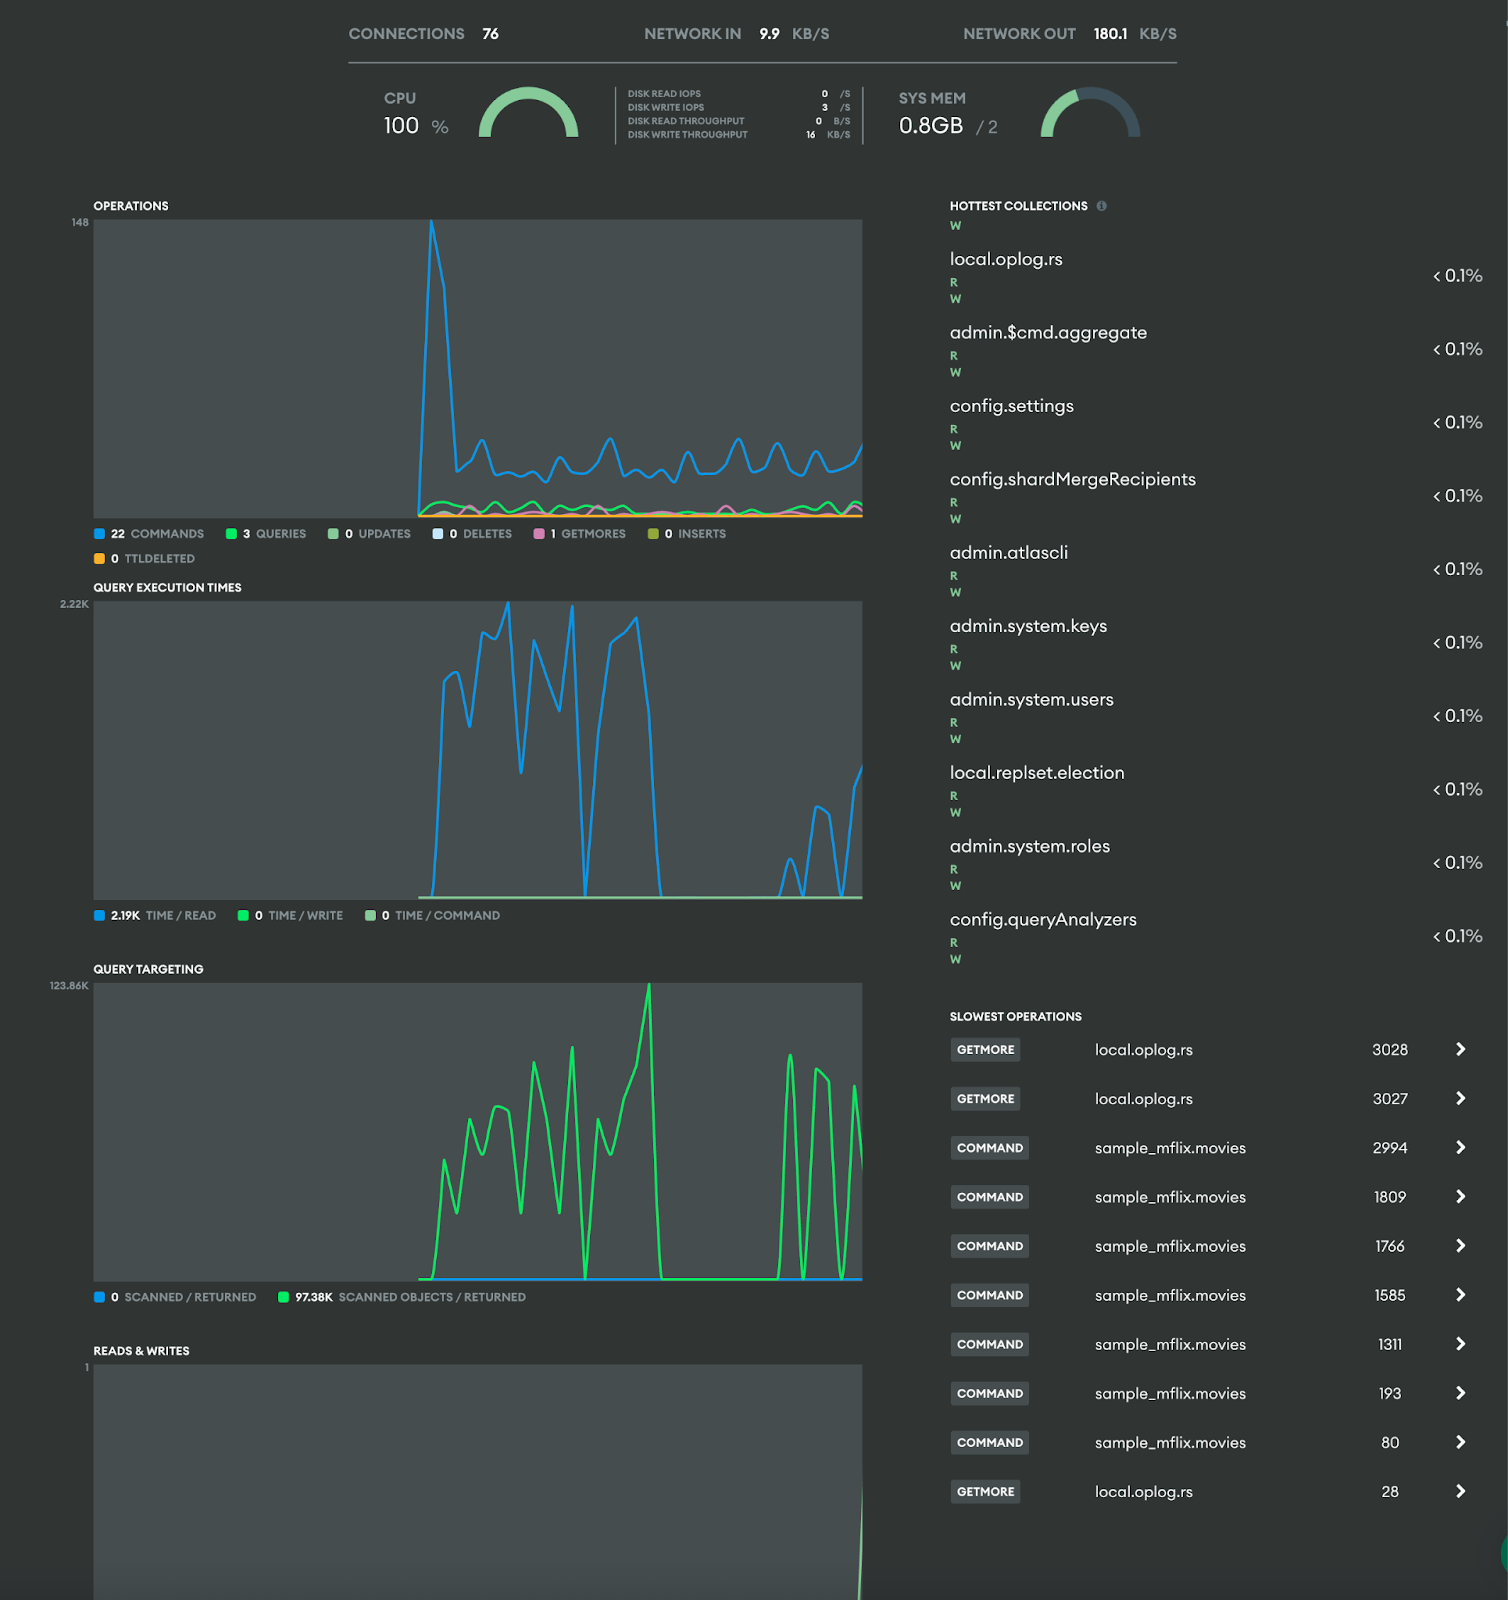
Atlas real-time metrics
On the bottom-right, we also see the slowest operations pointing to the movies collection, a strong indication that something in our aggregation was overloading the system. However, this alone doesn’t explain exactly what caused the spike.
Query insights: The detective tool
Following the clues, the next logical step is to open Query Insights, a tool that helps investigate performance issues in more detail. During the same time window, we can access the Query Profiler tab to view which operations took the longest to execute. There, we can often identify the query responsible for the high resource usage.
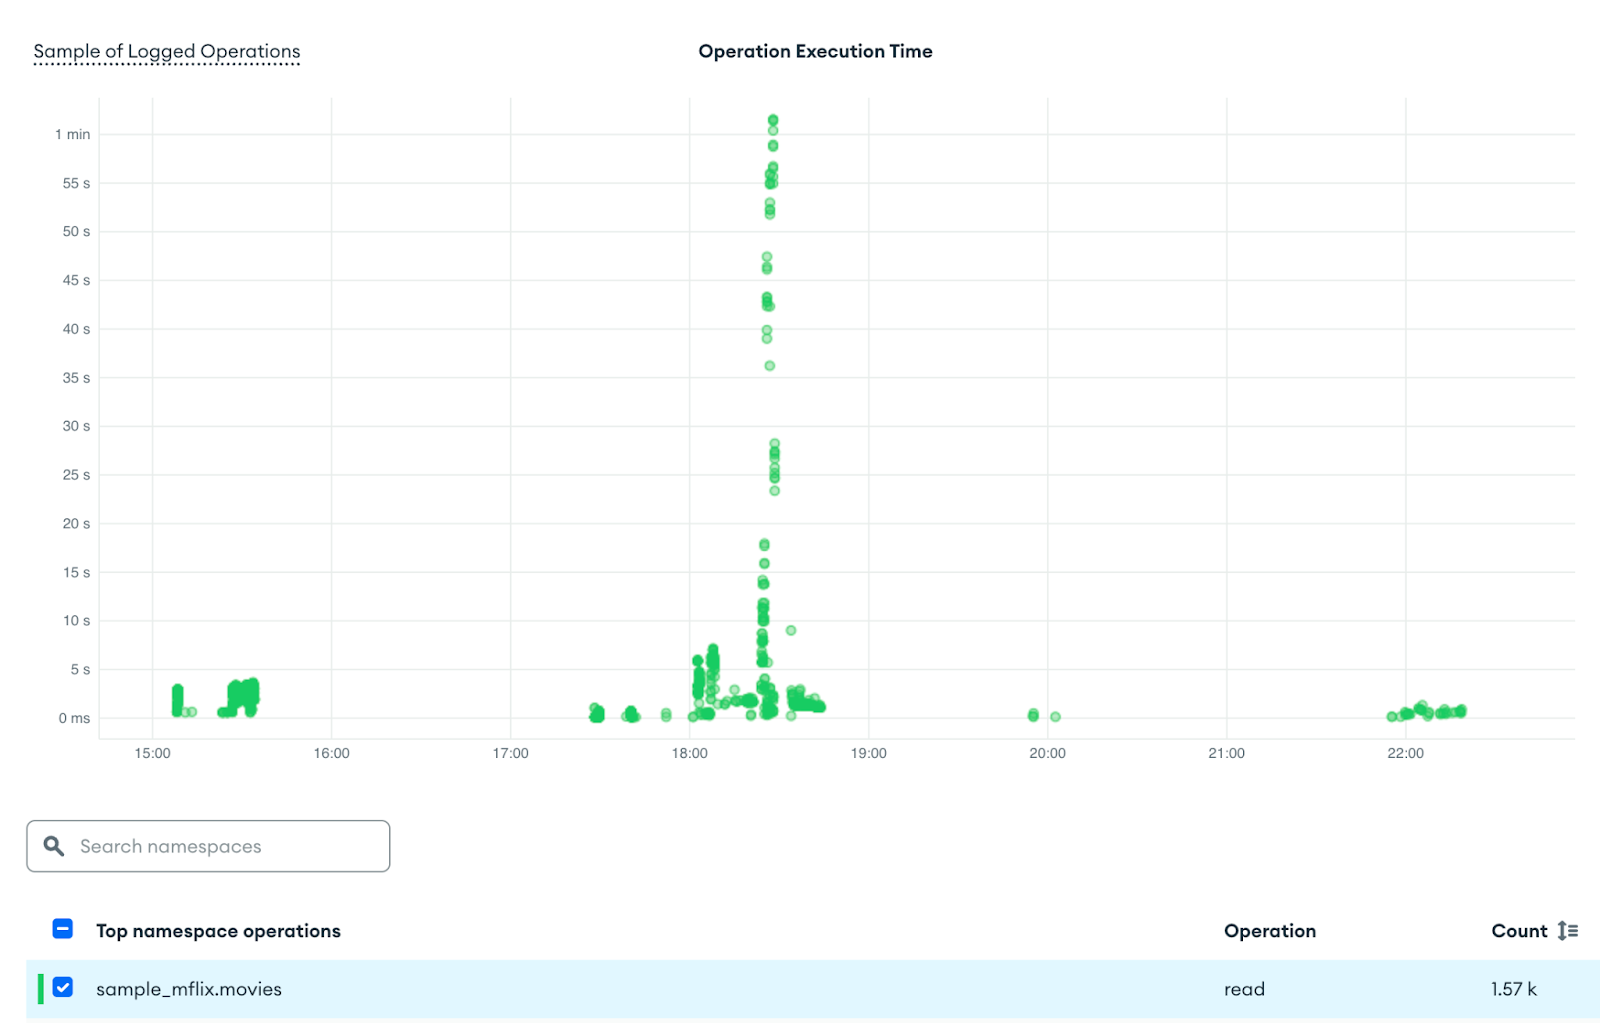
Query Profiler
As we can observe, between 18:00 and 19:00, the chart shows a clear spike in operation execution time. During this window, the duration of read operations on the movies collection increased quickly, starting from just a few milliseconds and reaching up to one minute.
Query Profiler
This sudden escalation confirms that the query began consuming significantly more resources, which aligns with the symptoms we observed earlier in the real-time metrics. The Query Profiler provided more concrete details: It shows the exact aggregation that was running, the total execution time (1.03min), and the number of documents examined:
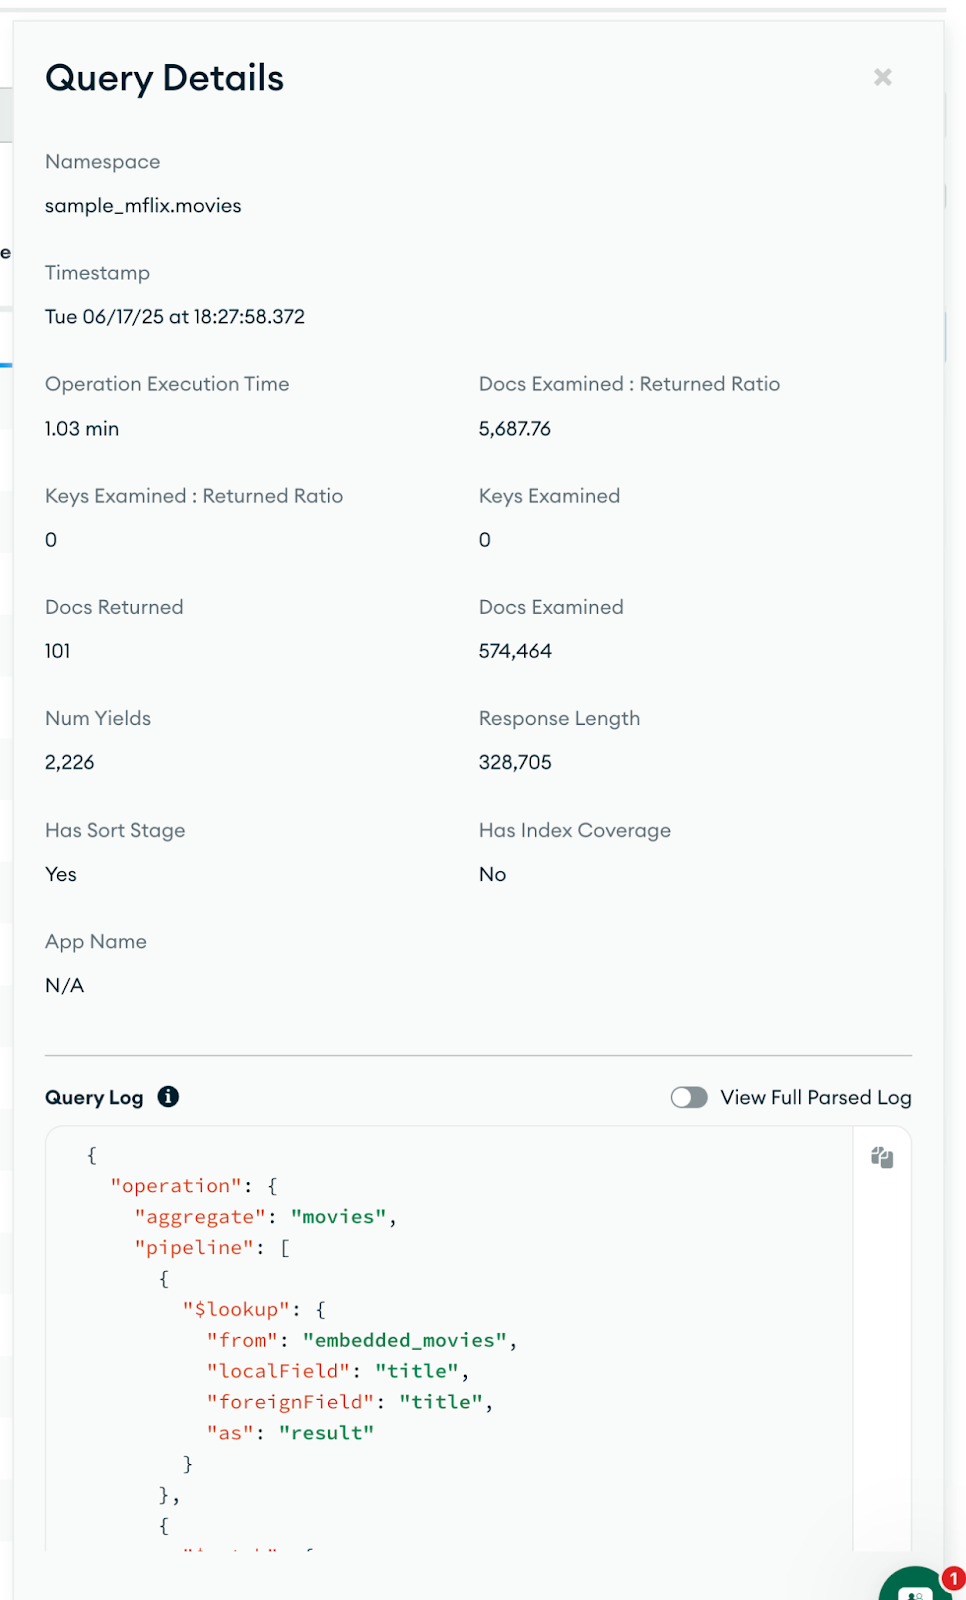
Query Profiler
With this information in hand, we can move toward a proper optimization solution or even make code adjustments to prevent the issue.
Don’t guess, let Performance Advisor show the way
Continuing our analysis, we have the /by-title-year endpoint, which returns movies filtered by title and year. Once the application is live in production, this endpoint starts receiving several requests to look up specific movies. That’s when we notice the query isn’t optimized, and we might not even know exactly how to improve it.
This is where the Performance Advisor comes in. M10+ clusters offer this feature under the Performance menu, providing valuable suggestions based on real-world usage. Select your cluster and click on the Performance Advisor tab:
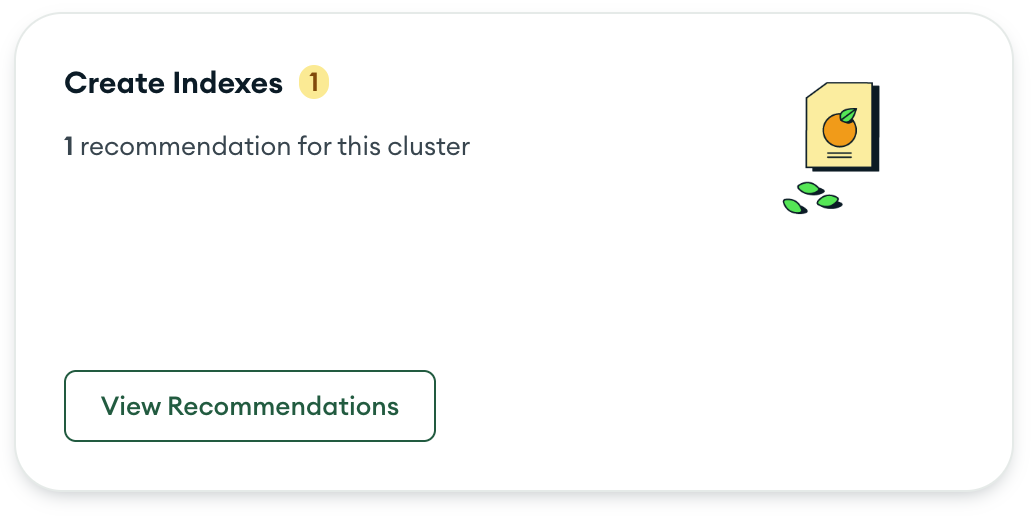
Performance Advisor recommendations
In our scenario, the Performance Advisor is suggesting the creation of an index for our cluster. By selecting View Recommendations, we can view the specific index suggestion that may help improve query performance:
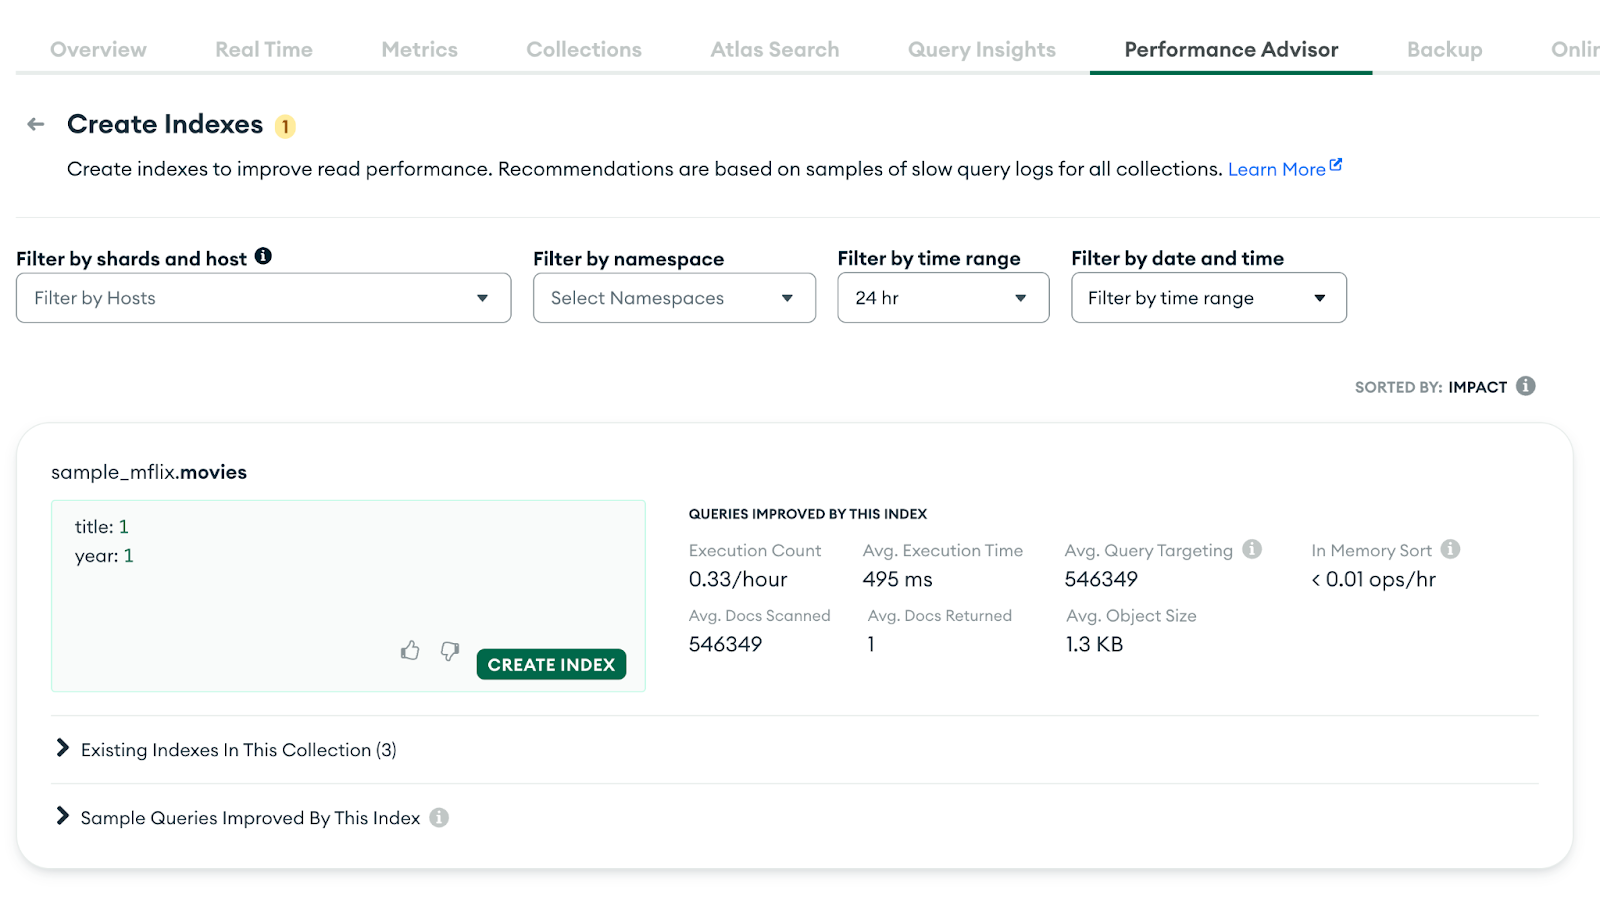
Performance Advisor index suggestion
Atlas is suggesting the creation of the { title: 1, year: 1 } index on the movies collection, as it directly matches the queries executed by our endpoint.
The query is quite simple, and the need for an index might be easy to spot manually. But in more complex scenarios, the Performance Advisor becomes a powerful ally during development.
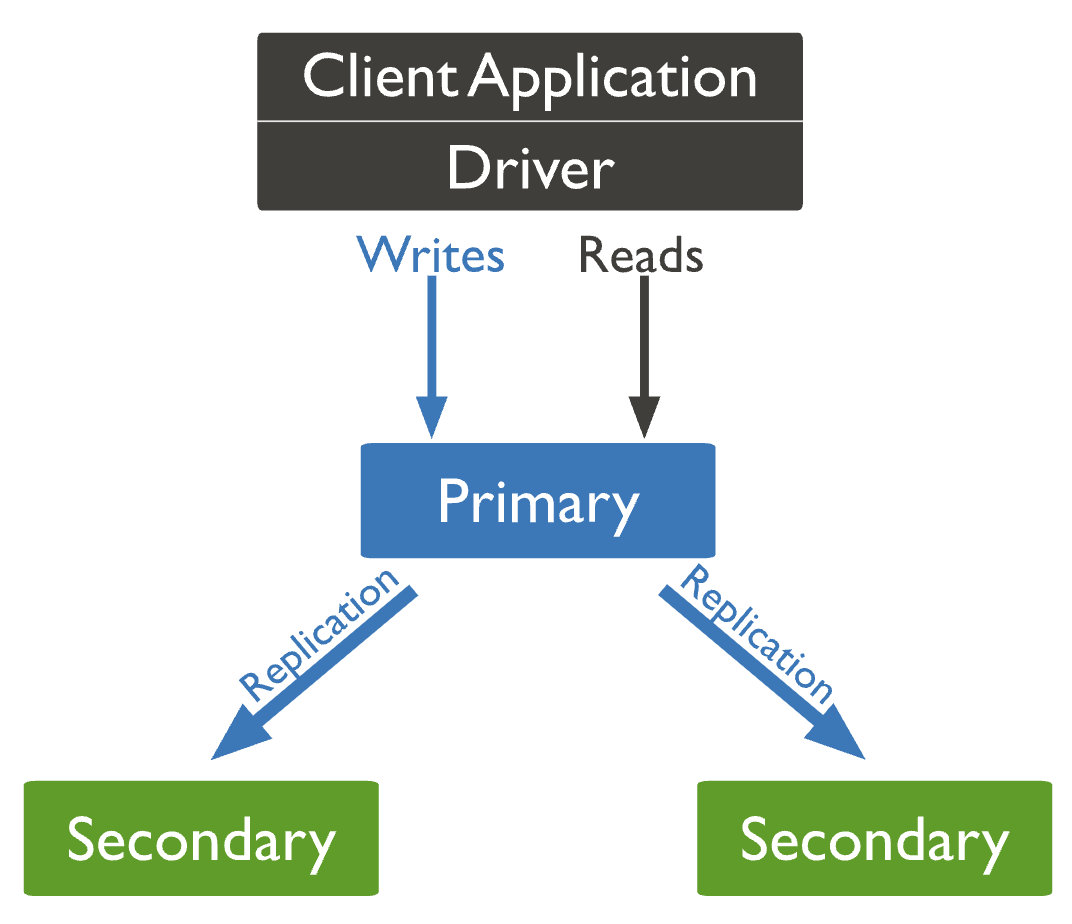
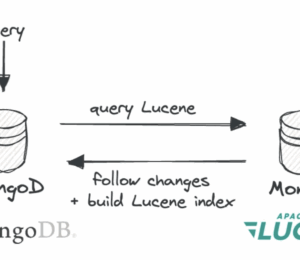
Resilience under pressure: Testing primary failover
A cluster configured in MongoDB Atlas operates as a replica set with three nodes. By default, there are two secondary nodes and one primary node, as shown in the image below:
MongoDB replica set
Replication
The primary node is responsible for handling all write operations. After each write, the data is automatically replicated to the secondaries, which may be deployed across different geographic regions.
This setup is especially valuable in scenarios involving backup and regional failures. Imagine, for instance, that the primary node is hosted in the São Paulo region, and that region becomes unavailable. In that case, the two secondary nodes in other regions still maintain up-to-date copies of the data.
Failover scenario
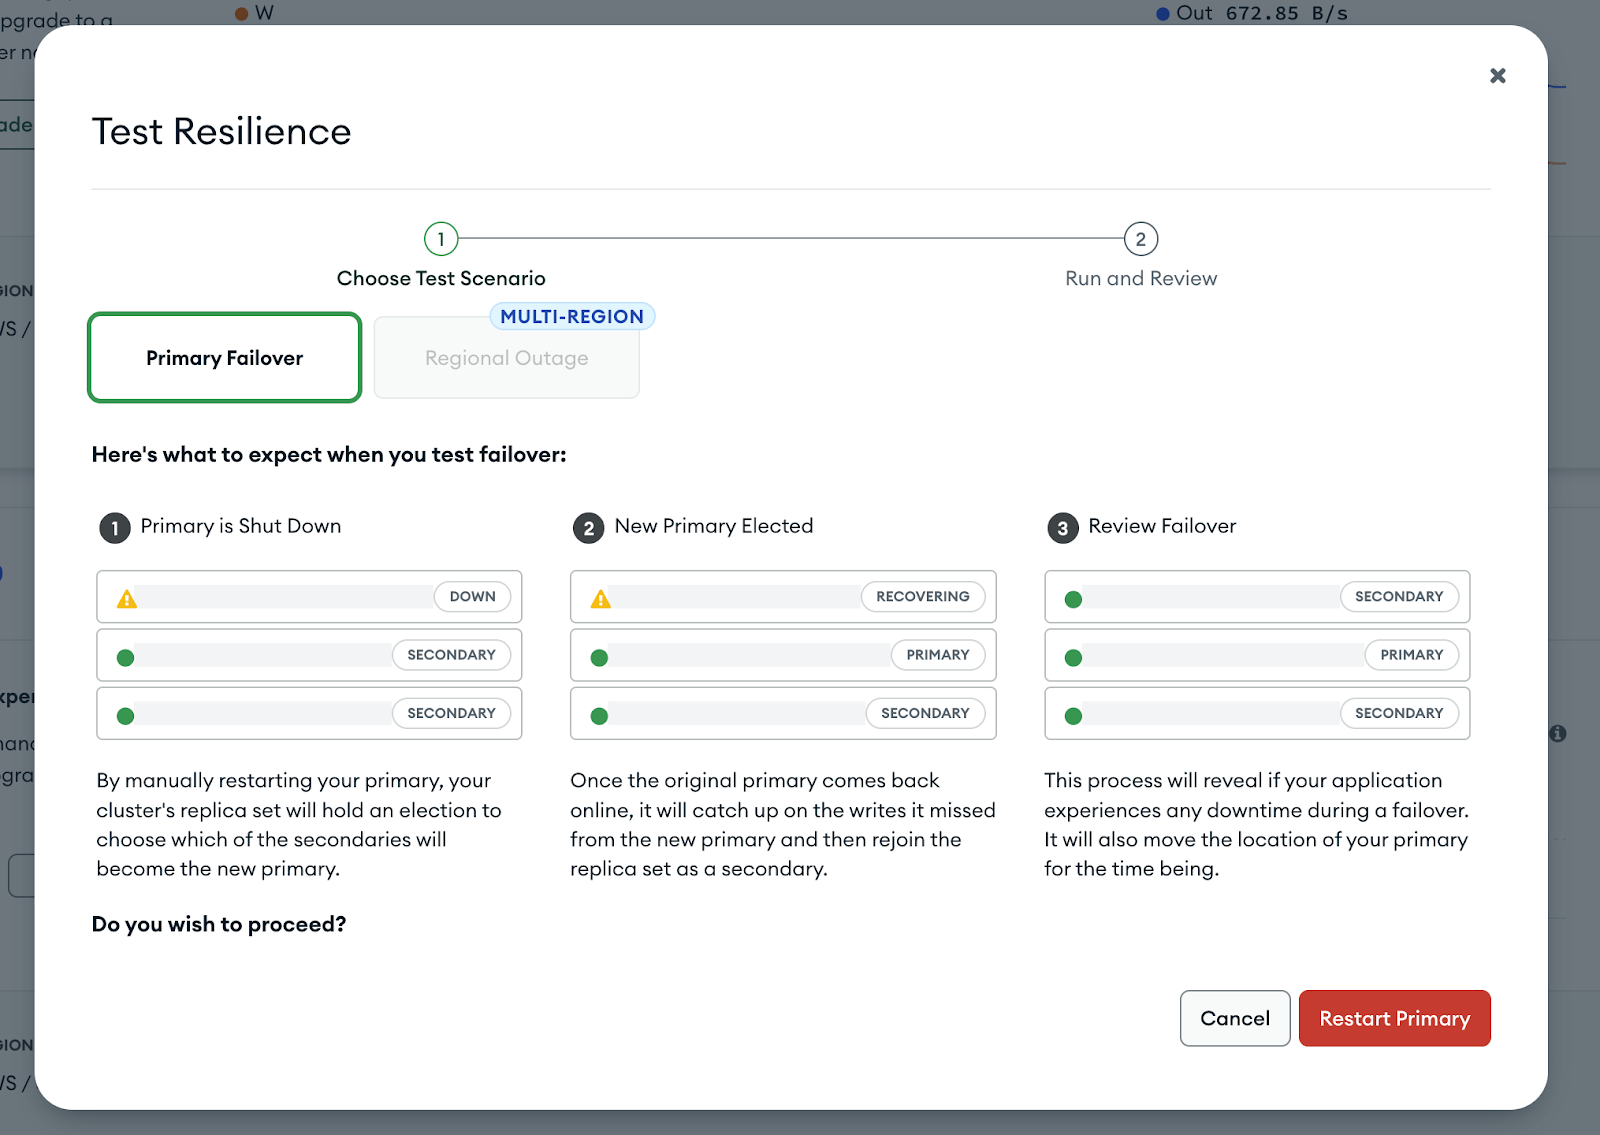
But what happens if the primary node fails? MongoDB will automatically initiate an election process among the secondaries to choose a new primary. Once elected, that node takes over all write operations. And the old primary? Once it recovers, it re-joins the replica set as a secondary node.
Although MongoDB handles this entire process automatically, it's equally important to ensure that your application also behaves as expected during a failover. That’s where M10+ clusters come in with the Primary Failover feature, which allows you to safely simulate a failover and observe how your application responds in real time.
The idea behind this feature is to force the current primary node to step down, triggering an election where a new primary is chosen. This simulates the failure of a node, helping you validate how well your application handles such an event.
Simulating application load
To ensure the application can handle a primary switch without interruptions, all we need is a simple method that performs both write and read operations to the database. These operations should continue running seamlessly, even during a primary failover. Here is the code:
int counter = 0;
while (true) {
   long startTime = System.currentTimeMillis();
   try {
       Document doc = new Document("counter", counter)
               .append("timestamp", new java.util.Date());
       collection.insertOne(doc);
       collection.find().sort(new Document("counter", -1)).first();
       long duration = System.currentTimeMillis() - startTime;
      logger.info("{}", String.format(
       "Attempt #%d → Write & Read completed in %dms%s",
       counter, duration,
       duration > 5000 ? " (This is slower than expected)" : ""
));
       counter++;
   } catch (Exception e) {
       long duration = System.currentTimeMillis() - startTime;
       System.out.printf("FAIL #%d - %dms - %s%n", counter, duration, e.getMessage());
   }
   Thread.sleep(1000);
}
This loop runs continuously, inserting and reading documents until the application is manually stopped. It’s just a temporary setup designed for experimentation, to confirm that the application continues writing and reading data during the failover process, not production-ready, but enough to validate behavior during failover.
Triggering the test in Atlas
While the loop is running, open your MongoDB Atlas dashboard. Find the cluster you want to test, click the ⋮ (three dots) menu, and select Test Resilience. This will initiate the failover process and let you observe how your application behaves in real time.
MongoDB Test Primary Failover
Once activated, simply observe your application logs to check for any anomalies or unexpected failures during the process.
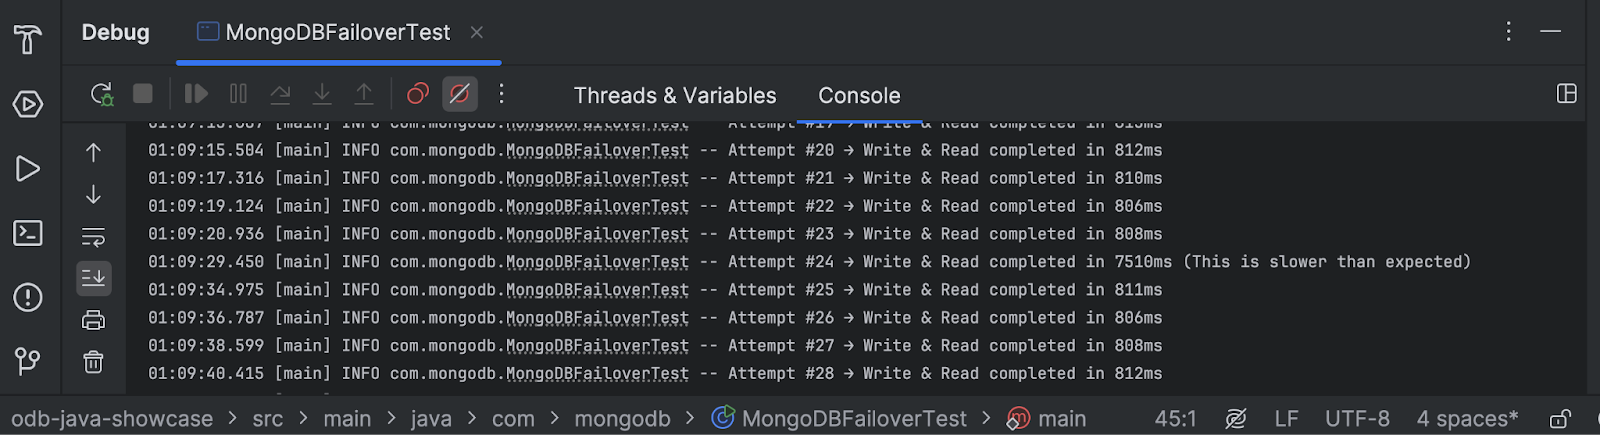
Application log
Throughout the entire process, your application should continue performing reads and writes normally. The goal is to ensure that your application handles replica set transition correctly, without requiring restarts or manual intervention.
What to look for:
- No unexpected exceptions in the logs.
- Guarantee that read/write operations works normally. It could be slow at some point but they should recover automatically.
- No need to restart connections, or the app.
If you want to go one step further, implement basic error handling around your MongoDB operations and add retry logic to validate that the app stays resilient in edge cases.
These kinds of tests are essential to ensure that the application continues to operate as expected.
Ready for production?
This experiment highlights the importance of simulating real-world conditions during development. Tools like Real-Time Performance Panel, Query Profiler, and Performance Advisor aren’t just nice to have. They’re essential for building with confidence.
The main lesson is clear: It’s not enough for your application or queries to just “work.” They need to be observable and validated in environments that reflect production. Identifying issues early can prevent costly surprises later, making the investment in a stronger dev environment well worth it.
If you have any questions, feel free to leave them in the comments. The complete code is available on the mongo-developer GitHub.
- July 28, 2025
- 9 min read
Ricardo is a Senior Software Engineer, focused on Java, Kotlin, and MongoDB, helping developers build secure, scalable, and cloud-native applications.


Comments (0)
No comments yet. Be the first.