Billion Events Per Second with Millisecond Latency: Streaming Analytics at Giga-Scale
- March 25, 2021
- 5 min read
This post is a part of a series:
- Part 1 (Intro and high-throughput streaming benchmark)
- Part 2 (batch workload benchmark)
- Part 3 (low-latency benchmark)
- Part 4 (concurrent GC with green threads)
- Part 5 (you are here)
We're preparing a scientific paper on Hazelcast Jet, describing its architecture based on symmetric, data-local, non-blocking distributed event processing. As a part of this effort, we implemented the vendor-neutral NEXMark benchmark suite, consisting of 8 streaming queries that aim to capture typical kinds of questions you're likely to ask about your real-time data.
The queries deal with a domain model of auctions, sellers, and bids. For example, Query 5 asks: "Which auctions have achieved the highest price in the last period?"
In contrast to our previous benchmarks, which focused on single-node performance (especially GC-induced latency spikes), this time we focus on horizontal scalability: how do Jet's latency and throughput behave as you add more and more nodes?
In a cluster of 45 nodes and 720 vCPUs, Jet reached 1 billion events per second at a 99% latency of 26 milliseconds.
Our Setup
We used the same configuration as in our earlier benchmarks:
- EC2 instance type c5.4xlarge (16 vCPUs)
- Oracle OpenJDK 15.0.1 with a single GC parameter:
-XX:MaxGCPauseMillis - Hazelcast 4.3
- Jet's thread pool size: 12 or 14
In our previous experience, we found you don't need any low-level GC tuning parameters to get great latency results on the JVM, but you do have to use a recent JDK. We let the JVM use its default G1 collector and configured it with our desired GC pause target. Also, note that we size Jet's thread pool a bit below the system capacity: up to 14 threads on 16-vCPU machines. This important trick allows the GC to work in the background without interfering with Jet's real-time computations.
As for the measuring methodology, it is the same as before. Events come from a generator that lives inside the same JVM as Jet. Every event has a predetermined moment of occurrence, and it is the generator's duty to emit it as soon as possible once that time has arrived. Any latency in emitting the event counts towards the reported latency.
On the output side, we stop the latency clock as soon we observe some data item corresponding to the newest result. We compare the system time at that point with the moment at which the query result would ideally become known. For example, if the query involves a time window, then the moment at which the window "closes", is that ideal moment.
We don't require Jet to send the results to any outside system, because we want our results to focus on Jet's performance alone. The code we used in the benchmark is available on GitHub.
Benchmark 1: 99.99th Percentile Latency with 20 ms Time Resolution
For the first benchmark we asked this question: using a time resolution of 50 result updates per second and an input rate of 1 million events per second, what is the 99.99% latency at different cluster sizes?
The main point of this benchmark is probing deep into the rare system events that may cause latency spikes, however the original definitions of NEXMark queries ask for a very low update frequency (once per minute). At this rate it would take 100 minutes to get barely enough data to report the 99th percentile latency, and a whole week to get the 99.99th percentile. Therefore we changed this to 50 times per second (20-millisecond update period).
Having to report another complete set of results (10,000 data points) every 20 milliseconds, Jet doesn't have time to recover from any hiccup greater than a few milliseconds. For this reason we configured the GC pause target to 5 milliseconds (-XX:MaxGCPauseMillis=5).
NEXMark doesn't define the number of distinct keys involved in the queries, we set it to 10,000 for this benchmark.
We used the setting of 12 Jet threads per node, mostly because that's what we used in the previous benchmarks. We got these results:
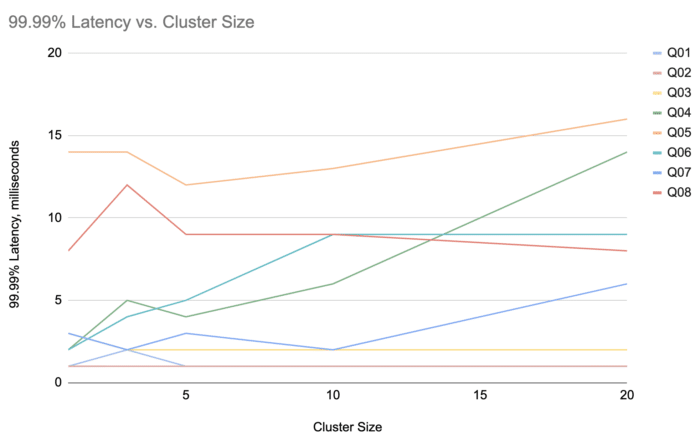
The overall worst case was Query 5 in the largest cluster (20 nodes),
and it came out as 16 milliseconds.
Benchmark 2: 99th Percentile Latency at a Billion Events per Second
Our second question was this: How much hardware would Jet need to reach a throughput of a billion events per second, while maintaining its millisecond-level latency?
To test this, we selected the NEXMark query that seemed the toughest on Jet given the results from Benchmark 1. This is Query 5, which showed a 99.99% latency 16 milliseconds in a 20-node cluster.
Since this time we'll create much more pressure on the input side, aiming for the highest possible throughput, we relaxed the timings a bit. We ask for two updates per second (a new result set every 500 milliseconds), and accordingly had to adjust our percentile to 99% in order to make it practical. We also relaxed the GC timing, setting -XX:MaxGCPauseMillis=50.
We started with just a single node, finding the maximum event rate Jet can keep up with. The definition of "keeping up" is that the latency stays bounded during the test and doesn't constantly increase. We repeated the process at increasing cluster sizes, until reaching our goal of one billion. Here is what we found:
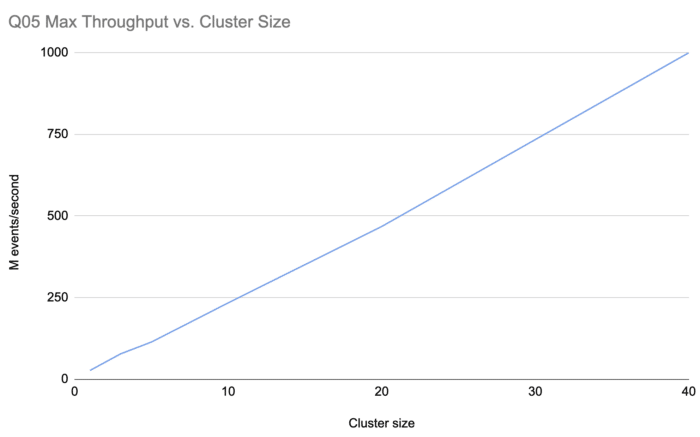
First of all, Jet was able to handle 25 million events per second on a single node and, even more impressively, this number kept scaling linearly all the way to our target, which it reached at a size of 40 nodes.
During the process we realized we could let Jet use more threads without impacting the latency, and since we wanted to minimize the number of EC2
instances, we let it use 14 threads. This still leaves 2 vCPUs to the background GC work and other system needs. If you look carefully, you can see the curve in the chart bending slightly upwards at the 20-node mark, this is an artifact of the 40-node measurements being taken with Jet using 8.6% more threads per node (14 vs. 12).
The criterion for maximum throughput is just keeping up with the input, allowing the latency to temporarily reach higher values as long as it settles back down. In order to gauge Jet's stable latency at various scales, we did another round of tests at 80% of the maximum throughput determined for each cluster size. This gave us the following latency chart:
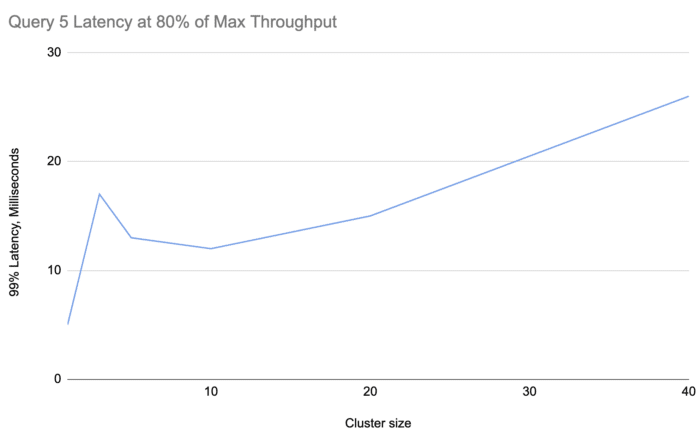
We can see that, although it's increasing, the latency stays pretty flat across a range of sizes well exceeding the capacity you'd probably need from Jet in real life.
Finally, we started from the setup that supported a billion events per second (40 nodes) and continued adding nodes until we got a stable low latency.
This was our result: 45 nodes, 26 milliseconds.
If you enjoyed reading this post, check out Jet at GitHub and give us a star!
- March 25, 2021
- 5 min read



Comments (0)
No comments yet. Be the first.