

Performance of Modern Java on Data-Heavy Workloads: The Low-Latency Rematch
- June 23, 2020
- 8 min read
This post is a part of a series:
- Part 1 (Intro and high-throughput streaming benchmark)
- Part 2 (batch workload benchmark)
- Part 3 (you are here)
- Part 4 (concurrent GC with green threads)
- Part 5 (billion events per second)
This is a followup on Part 1 of the blog post series we started earlier this month, analyzing the performance of modern JVMs on workloads that are relevant to the use case of real-time stream processing.
As a quick recap, in Part 1 we tested the basic functionality of Hazelcast Jet (sliding window aggregation) on two types of workload: lightweight with a focus on low latency, and heavyweight with a focus on the data pipeline keeping up with high throughput and large aggregation state. For the low latency benchmarks we chose the JDK 14 as the most recent stable version and three of its garbage collectors: Shenandoah, ZGC, and G1 GC.
Our finding that Shenandoah apparently fared worse than the other GCs attracted some reactions, most notably from the Shenandoah team who reproduced our finding, created an issue, came up with a fix, and committed it to the jdk/jdk16 repository, all in the span of a few days. The change pertains to the heuristics that decide how much work the GC should do in the background in order to exactly match the applications allocation rate. This component is called the pacer. It was constantly detecting it's falling behind the application, triggering a brief "panic mode" in order to catch up. The fix fine-tunes the pacer's heuristics to make the background GC work more proactive.
Given this quick development, we wanted to test out the effects of the fix, but also take the opportunity to zoom in on the low-latency streaming case and make a more detailed analysis.
Here are our main conclusions:
- ZGC is still the winner and the only GC whose 99.99th percentile latency stayed below 10 ms across almost all of our tested range
- Shenandoah's pacer improvement showed a very strong effect, reducing the latency by a factor of three, but still staying well above 10 ms except in the very lowest part of our tested range
- G1 kept its 99.99th percentile latency below 13 ms across a wide range of throughputs
The JDK We Tested
Since this is all so fresh, we couldn't use an existing JDK release, not even EA, to see the effects of the fix. JDK version 14.0.2 is slated to be released on July 14. To nevertheless make progress, we took the source code from the jdk14u tree, at the changeset number 57869:e9d41bbaea38, and applied the changeset number 59746:29b4bb22b5e2 from the main jdk tree on top of it. The jdk14u tree is where JDK 14.0.2 will be released from and the changeset 59746:29b4bb22b5e2 applies the patch resolving the mentioned Shenandoah issue.
The JVM Options
There are two HotSpot JVM options whose default values change automatically when you use the ZGC so we had to decide which choice to make when testing the other garbage collectors.
-XX:-UseBiasedLocking: biased locking has for a while been under criticism that it causes higher latency spikes due to bias revocation that must be done within a GC safepoint. In the upcoming JDK version 15, biased locking will be disabled by default and deprecated. Any low-latency Java application should have this disabled and we disabled it in all our measurements.-XX:+UseNUMA: Shenandoah and ZGC can query the NUMA layout of the host machine and optimize their memory layout accordingly. The only reason why Shenandoah doesn't do it by default is a general precaution against suddenly changing the behavior for upgrading users, but the precaution is no longer necessary. It will be enabled by default in upcoming JDK versions, and we saw no harm in enabling it in all cases as well. Late update: G1 can also optimize for the NUMA layout, but we didn't useUseNUMAfor it. However, we also checked the c5.4xlarge instance withnumactland it indicated that the entire machine was a single NUMA node anyway.
There is also a JVM feature that is simply incompatible with ZGC's colored pointers: compressed object pointers. In other words, ZGC applies -XX:-UseCompressedOops without the option to enable it. A compressed pointer is just 32 bits long but handles heaps of up to 32 GB and it's usually beneficial to both memory usage and performance. We left this option enabled for Shenandoah.
For the G1 collector, we also set -XX:MaxGCPauseMillis=5, same as in the previous testing round, because the default of 200 milliseconds is optimized for throughput and the G1 can give you much better latency than that.
We performed all our tests on an EC2 c5.4xlarge instance. It has 16 vCPUs and 32 GB of RAM.
The Data Pipeline
To get a more nuanced insight into the performance, we made some improvements to the testing code. Whereas in the first iteration we just reported the maximum latency, this time around we wanted to capture the entire latency profile. To this end we had to increase the number of reports per second the pipeline outputs. Initially we set it to 10 times per second, a number which results in too few data points for the latency chart. The pipeline in this round emits 100 reports per second. The event rate and the length of the time window are the same: 1 million events per second and 10 seconds, respectively. This results in 1,000 hashtables each holding 10,000 keys as the aggregation state. We tested across a wide range of keyset sizes, starting from 5,000 up to 105,000.
Note that the size of the keyset, somewhat counterintuitively, does not affect the size of the aggregation state. As long as the 10,000 input events received during one time slice of 10 milliseconds all use distinct keys, the state is fixed as described above. Only in the lowest setting, 5,000, the state is half as large since every hashtable contains just 5,000 keys.
What the keyset size does affect is allocation rate. The pipeline emits the full keyset every 10 milliseconds. For example, with 50,000 keys that's 5,000,000 result items per second. If we add to that the rate of the input stream (a fixed million events per second), we get a value that is a good proxy for the overall allocation rate. This is why we chose combined input+output rate as the x-axis value in the charts that we'll be showing below.
Here is the basic code of the pipeline, available on GitHub:
StreamStage<Long> source = p.readFrom(longSource(EVENTS_PER_SECOND))
                            .withNativeTimestamps(0)
                            .rebalance();
StreamStage<Tuple2<Long, Long>> latencies = source
        .groupingKey(n -> n % NUM_KEYS)
        .window(sliding(WIN_SIZE_MILLIS, SLIDING_STEP_MILLIS))
        .aggregate(counting())
        .filter(kwr -> kwr.getKey() % DIAGNOSTIC_KEYSET_DOWNSAMPLING_FACTOR == 0)
        .mapStateful(DetermineLatency::new, DetermineLatency::map);

latencies.filter(t2 -> t2.f0() < TOTAL_TIME_MILLIS)
         .map(t2 -> String.format("%d,%d", t2.f0(), t2.f1()))
         .writeTo(Sinks.files("/home/ec2-user/laten"));
latencies
      .mapStateful(RecordLatencyHistogram::new, RecordLatencyHistogram::map)
      .writeTo(Sinks.files("/home/ec2-user/bench"));
The main part, sliding window aggregation, remains the same, but the following stages that process the results are new. We write the data to two files: laten, containing all the raw latency data points, and bench, containing an HDR Histogram of the latencies.
Another key difference is that, in the original post, we measured the latency of completing to emit a result set, but here we measure the latency of starting to emit it. Since we are changing the size of the output, if we kept measuring the completion latency, we'd be introducing a different amount of application-induced latency at each data point.
There's another, relatively minor technical point worth mentioning: since we tested on a cloud server instance, we used Jet's client-server mode, which means we separately start a Jet node and then deploy the pipeline to it using Jet's command jet submit. The code available on GitHub is the client code and the Jet server code was a build from the Jet master branch before Jet 4.2 was released. We expect all the results to be reproducible with the Jet 4.2 release.
What Exactly We Measured
We measured the latency as the timestamp at which the pipeline emits a given result minus the timestamp to which the result pertains, giving us end-to-end latency (the only kind the user actually cares about).
Keep especially in mind that latency does not equal a GC pause. Normally, neither Shenandoah nor ZGC enter anything more than a millisecond of GC pause, but their background work shares the limited system capacity with the application. With G1 the equivalence is much stronger and its 10-20 millisecond latencies are primarily the result of GC pauses that long.
The Measurements
To come up with the charts below, for each data point we let the pipeline warm up for 20 seconds and then gathered the latencies for 4 minutes, collecting 24,000 samples.
Here is the latency histogram taken at 2 million items per second, close to the bottom of our range:
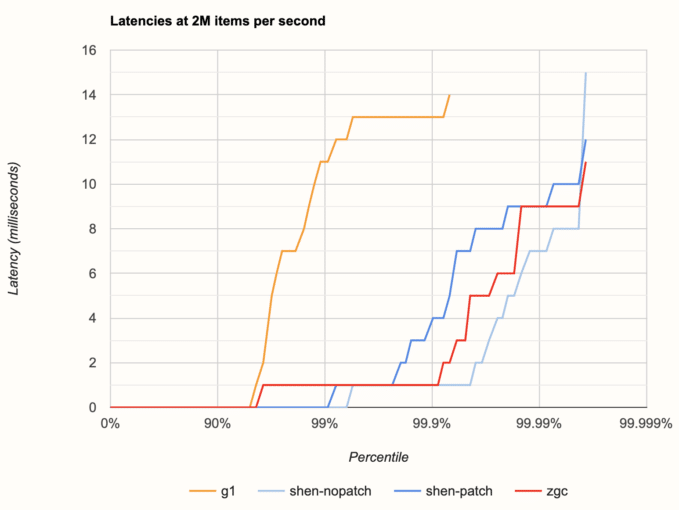
Unpatched Shenandoah seems like the winner, except for the single worst-case latency. With the patch applied, latency increases sooner but more gently and doesn't have a strong peak. ZGC comes somewhere between, but overall all three cases show pretty similar behavior. G1 is clearly worse and its latency exceeds the 10 ms mark before even reaching the 99th percentile. Since our pipeline emits a new result set ever 10 ms, we shall consider 10 ms as the cutoff point: everything above 10 ms should be considered a failure for our use case.
Next, let's take a look at the latencies after increasing the throughput a bit, to 3 million items per second:
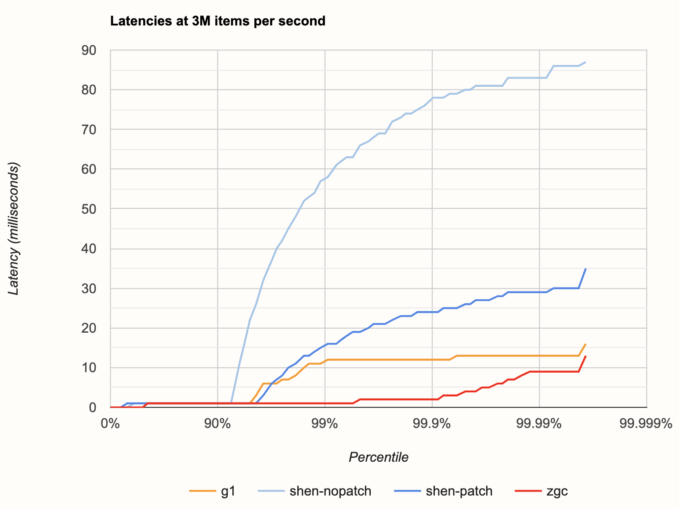
Wow, what an unexpected difference! Now we can clearly see the pacer improvement doing its thing, lowering the latency about threefold. However, even with the improvement, Shenandoah unfortunately crosses the 10 ms mark pretty early, below the 99th percentile, and is worse than G1 at almost every percentile. ZGC and G1 score basically the same as before.
Note also the very regular shape of the pale blue curve (unpatched Shenandoah): this is a symptom of the way a single bad event trickles down into the lower latency percentiles. For example, if one result is late by 50 ms, that means it has already caused the next four results to have at least the latencies of 40, 30, 20, and 10 ms, even if they would be emitted instantaneously.
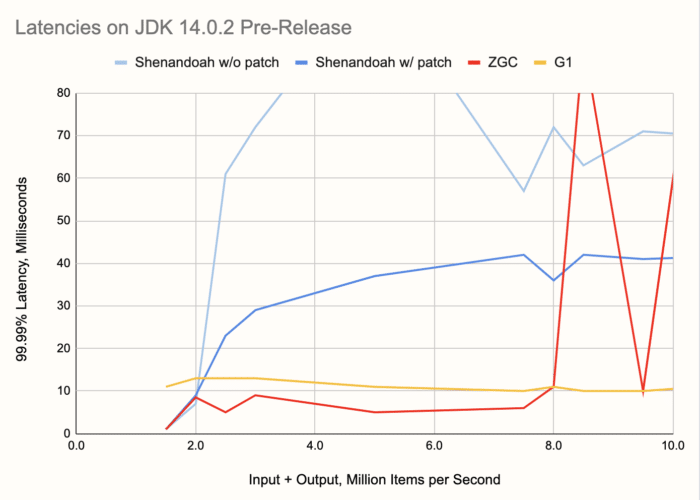
Next, let's zoom out to an overview of the entire range of throughputs we benchmarked, taking the 99.99%ile as the reference point and showing its dependence on throughput. To paint an intuitive picture, 99.99% latency tells you that, in any span of 100 seconds you look at, you're likely to find a latency spike at least that large. Here's the chart:
Here are some things to note:
- ZGC stays below 10 ms over a large part of the range, up to 8 M items per second. This makes it not just the winner, but the only choice for the range from 2 million to 8 million items per second.
- The G1 collector is unphased by the differences in throughput. While its latency is never under 10 milliseconds, it keeps its level over the entire tested range and more. Its latency even improves a bit with higher loads.
- At 9.5 M items per second, ZGC shows a remarkable recovery. Sandwiched between the latencies of 92 and 209 milliseconds, at this exact throughput it achieves 10 ms latency! We of course thought it was a measurement error and repeated it for three times, but the result was consistent. Maybe there's a lesson in there for the ZGC engineers.
A Sneak Peek into Upcoming Versions
As a preview into what's coming up in OpenJDK, we also took a look at the Early Access release 27 of JDK 15. Shenandoah's pacer improvement is not applied in it, so to properly test Shenandoah's prospects we used a build available at builds.shipilev.net/openjdk-jdk, specifically one that reports its version as build 16-testing+0-builds.shipilev.net-openjdk-jdk-b1282-20200611. Out of interest, we also doubled our throughput range to capture more of the behavior after the latency exceeds 10 milliseconds. Here's what we got:
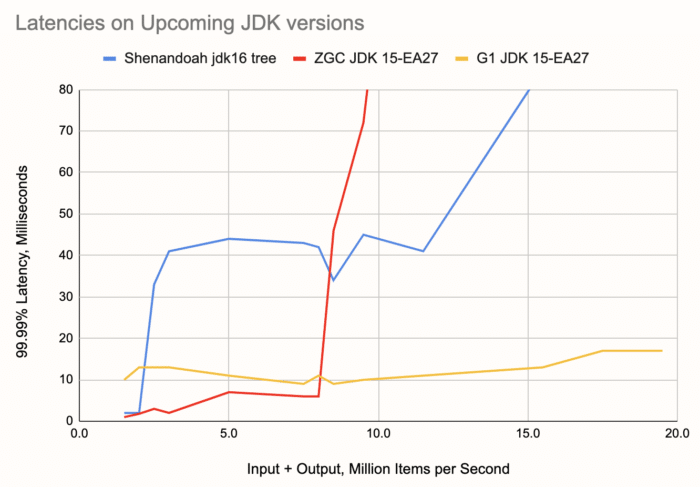
We can see a nice incremental improvement for the ZGC: less than 5 ms latencies at throughputs below 5 M/s. Shenandoah's curve is even a bit worse at 2.5-3 M per second, but generally pretty similar. At higher loads we can see ZGC's failure mode is quite a bit more severe than Shenandoah's, although just how bad the latency gets doesn't affect the bottom line of a scenario where everything above 10 ms is already a failure.
The wider chart also gives better insight into the stability of G1, keeping itself below 20 ms all the way up to 20 M items per second.
If you enjoyed reading this post, check out Jet at GitHub and give us a star!
- June 23, 2020
- 8 min read
Marko Topolnik, PhD, has been a Java professional since 2001. His current position is in the core team of Hazelcast Jet, where he co-wrote the core execution engine based on coroutine-like suspendable code that runs many concurrent tasks on a fixed thread pool. Marko is also an active contributor on Stack Overflow on the kotlin-coroutines tag.


Comments (0)
No comments yet. Be the first.