Exception Breakpoint that Doesn’t Suck and a Real Use Case for Method Breakpoints
- April 22, 2022
- 5 min read
Two weeks ago, I left this series in a “cliffhanger” of sorts. Well, as much as a programming blog can leave things in the air… The big one amongst them is the premise that exception breakpoints don’t have to suck. If you used them in the past, you would know that grabbing all exceptions is ridiculous. You end up at a breakpoint every second and it doesn’t help.
There’s a solution, and it’s discussed in duckling 6 number 7 also covers a lot of interesting ground for us and another cliffhanger on method breakpoints:
🦆 Duckling the 7th:
Remember I told you not to use method breakpoints?
Except for one use case... Here it is and it's amazing!
Did you know you can see all the object instances of a given type in the VM?
That and more...#CodeNewbie #140SecondDucklings pic.twitter.com/5gIMdrV2m7— Shai Almog (@debugagent) March 22, 2022
Filters
Filters solve the problem of “noisy” breakpoints. They let us limit a breakpoint to a very specific narrow area, which we can then inspect more casually. When debugging a major project, this is an invaluable tool at our disposal.
Catch Class
This one feature makes exception breakpoints worth having. But let’s back up a bit and discuss the problem… At least for JVM languages.
For a typical web request, Java needs to perform many operations for which the only response is an exception. E.g. a URL request would require header parsing. If a number in the header differs from what you expected, a NumberFormatException will be thrown… It’s caught inside the JVM implementation, since it’s expected.
But the exception breakpoint support will still break for this and many other exceptions in the JVM code. For any non-trivial applications this is a problem.
The solution is simple. Filter out the catching classes if they are in the java or sun root packages. We can do this in the current breakpoint dialog using the filter -java.* -sun.*, notice the - character used to filter out the packages. This one small class filter will remove that redundant noise and let you focus on exceptions that you catch or don't. An uncaught exception is almost always useful in the debugger, as it can lead to an application fatal error.

You can add additional filters to cover other libraries and your own classes as needed. This is a remarkable feature!
Of all the breakpoint types, I feel these have the most untamed potential. I hope more people turn this on by default with this filter (which should itself be the default).
Instance
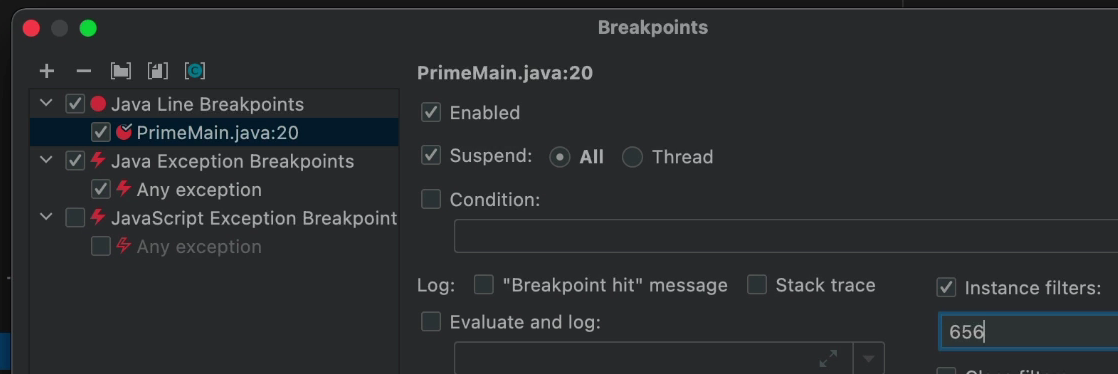
This limits the breakpoint to the current object. This is something I would normally use a conditional breakpoint for. The problem is that conditions might cause a mistake, e.g. in a case where instances are harder to differentiate. Conditions also require more work.

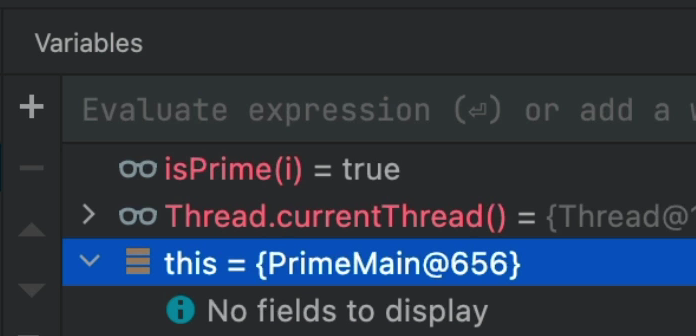
When applying an instance filter, you need to get the object ID from the watch and use that for the field.

Class
Class filter seems redundant at first until we look at the more elaborate breakpoints we have in place. A good example is field watchpoint, which can be triggered by access from a different class, assuming the field isn't private.
Let's say you have a public field and you're concerned someone is reading or writing to it from outside of your class. Your code can't be changed as there's too much legacy. Usage info shows you who's using it, but it's spread all over the place... You just want to see if someone from outside the class is physically accessing the field at this frame of time...
In that case, you can add a class filter to only break in the field watch point for access that isn't from the set of classes.
Caller
Have you ever reached a breakpoint and looked at the stack... Then kept pressing continue until that stack changed to include the method you wanted in the stack. The one that invoked your call. This is where the caller filter comes in. You can exclude a specific stack element from consideration or require a specific method.
Method Breakpoint
You may recall I mentioned you shouldn't use method breakpoints... They're usually just emulated by line breakpoints to avoid their typical overhead. So there's no actual need for them when placing one on a method.
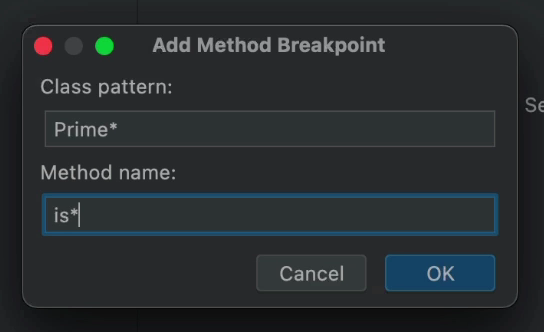
But there's another approach. You can add a breakpoint using filters/names, e.g. you can add a breakpoint to all the methods starting with the word "is" in all the classes starting with the word "Prime" as we can see here.

This might sound excessive, but there's a common and valid use case.
Imagine using a complex polymorphic API that follows a naming convention. It's hard to know which method is invoked to handle which behavior. This way, you can grab all suspects using a simple pattern.
So how do you deal with the excessive noise?
We can use a conditional breakpoint just like we can in any other area of the program. We can use tracepoints and pretty much any other option in the list above.
Show Objects
For the last section, I'm going to go to the watch instead of the current breakpoint discussion. This is a feature that's so cool and so simple... Yet unfamiliar to many developers.
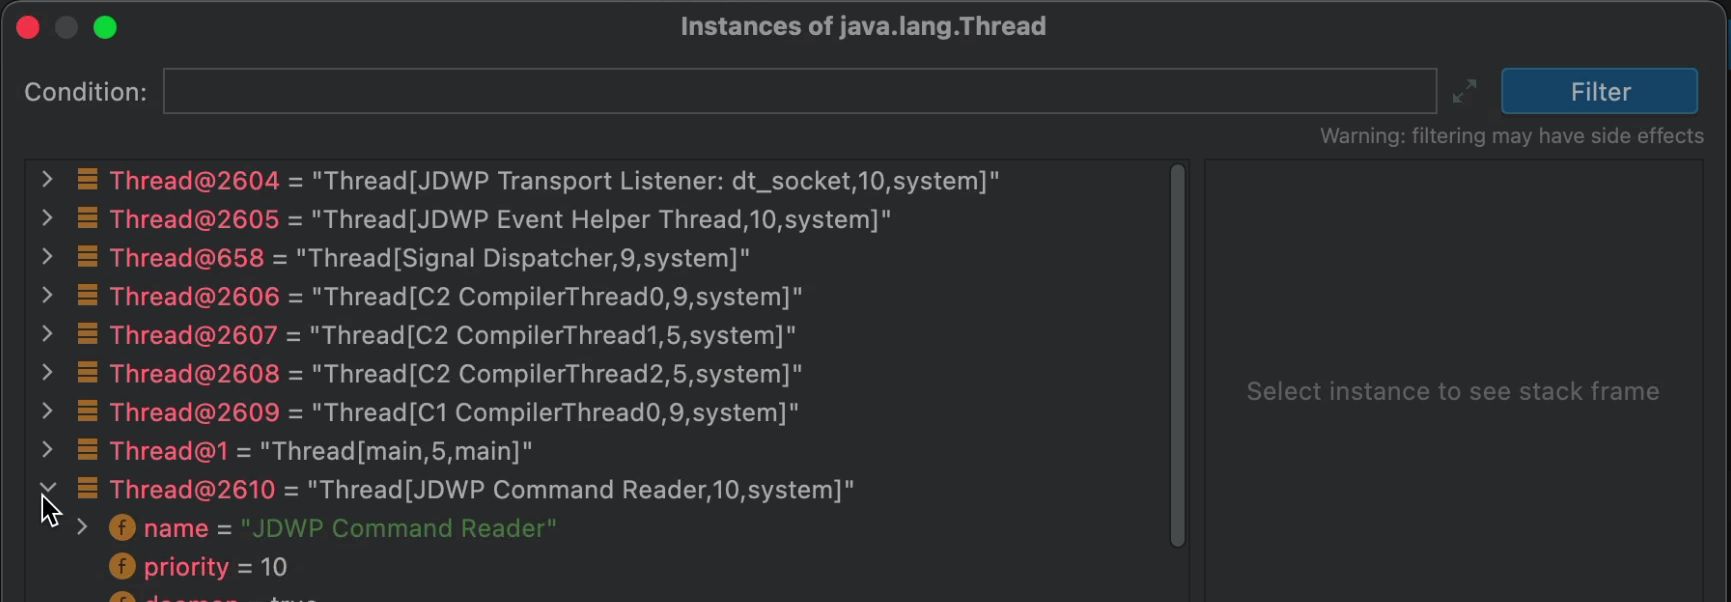
When you right click an Object in the IntelliJ watch you can ask to show "all objects". This literally means ALL OBJECTS in the process!
When you do that on a Thread object, you see the JIT compiler thread. You can see internal JVM const message strings when doing it on a String array. When you're looking at a specific object and wondering "is this the right instance", well... You can review all instances and verify with a right click.

You can even narrow down that list with an expression statement to make it even more useful for a larger list of objects.
TL;DR
I hope this blew your mind. There are so many debugger capabilities that we sometimes gloss over when trying to build an application. The tools we discussed today are all designed for debugging large code bases. Where the capabilities of these tools really shine.
These tools let us easily define complex logic in runtime that can lead us directly to the problem area in the application code.
When you incorporate these capabilities into your debugging process, it will pay back with dividends.
- April 22, 2022
- 5 min read


Comments (0)
No comments yet. Be the first.