Firefox Profiler Beyond the Web
- February 02, 2023
- 6 min read
This blog post is the base of the first half of my upcoming talk at FOSDEM 2023 on the topic "Firefox Profiler beyond the web: Using Firefox Profiler to view Java profiling data."
For the impatient: Take a look at my Java JFR Profiler IntelliJ plugin to easily profile your application and view JFR files directly in your IDE.
I got involved in the Firefox Profiler development, spending significant portions of my time at SAP in the last half year on it. It has been an exciting ride. I learned a lot and contributed a few features. So I was essentially developing React code when I wasn't working on ASGST or other OpenJDK-related tools.
But you may well ask the most important of all questions: Why? Why did I spend so much time on a profiler for JavaScript and the Firefox browser? It all started in August 2022...
How did I end up there?
I developed code related to the Java debugging protocol in the second quarter of 2022. I had grand plans, but it eventually did turn out to be far more complicated than expected, but that is a story for another blog post.
You can read my short primer on Java debugging internals to get a glimpse of this work. During the development, I encountered a problem: How can I profile my code, especially unit tests? I had many unit tests like the following, which tested specific aspects of my code:
@Test
public void testEvaluateSwitchStatement() {
    var program = Program.parse("((= x 1) (switch (const x)" +
        "(case 1 (= v (collect 2))) (case 2 (= v (collect 1)))" +
        "))");
    var funcs = new RecordingFunctions();
    new Evaluator(vm, funcs).evaluate(program);
    assertEquals(List.of(wrap(2L)), funcs.values);
}
I wanted to use an open-source profiler, as I had no access to the paid version of IntelliJ, which includes profiling support. Multiple tools are available, but it essentially boils down to async-profiler and JMC. Both tools have their advantages and disadvantages regarding their UI, but it essentially boils down to ease of use vs. available features:

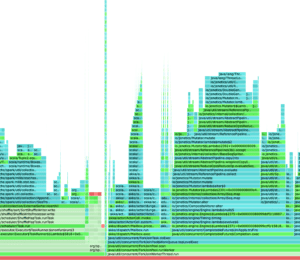
Async-profiler and its profiling visualizations are easy to use but do not have that many features. The only available visualization is flamegraphs with minimal interactivity, just zooming is supported. Flamegraphs are the bread-and-butter of profiling:

If you want more visualizations, like a tree view, timelines, or a JFR event view, you can export your profile into JFR format (or use JFR to record your profile directly) and view it in JMC. But the difference between the ease of use of both is vast: Whereas the flamegraphs of async-profiler are usable by anyone with a short introduction, using JMC has a steep learning curve, it is currently more a tool for experts to dig deep into the profiling data. This observation leads us to the first problem: There is, to my knowledge, no open-source tool that offers more visualizations than just flamegraphs and is as easy to use.
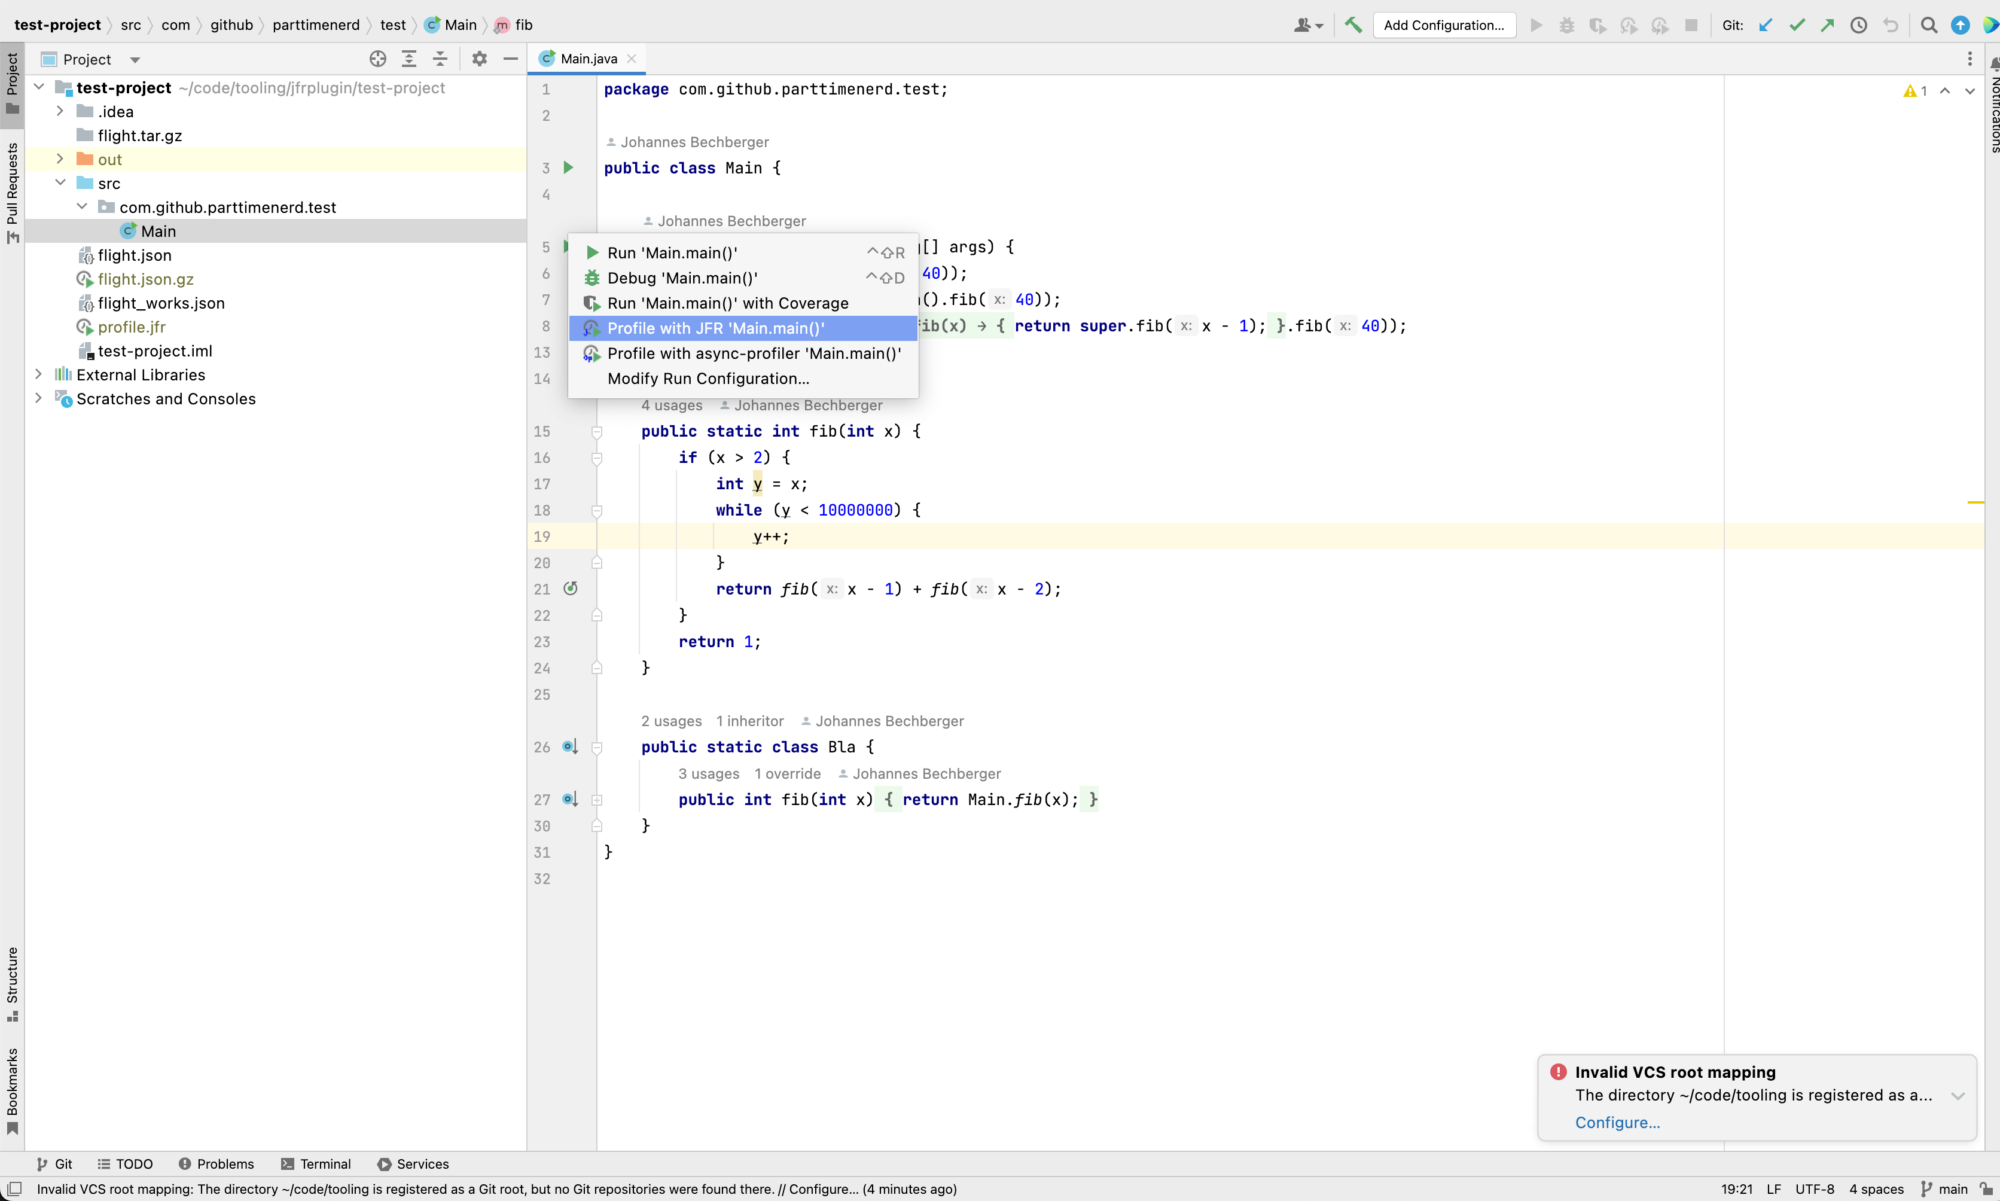
Another problem with both async-profiler and JFR is the missing integration into IDEs. I would like to just click on a button in a context menu to profile an individual test case:

Without the hassle of creating a main method that just calls this method: I want to be able to profile it by modifying the JVM options of a run configuration.
I thought I was probably not the only one with this use case who stumbled upon the two problems impeding profiling. I had some spare time in August, so I looked for ways to build a tool myself.
Building a basic version of an IDE plugin that solves the second of my two problems is relatively easy. There is already the open-source profiling plugin Panda by Rastislav Papp, on which I based mine. Panda has only a simple tree view visualization, so it does not cover my first problem with visualizations. So I still had to figure out how I could implement the UI. Implementing it directly in the IDE in Java is cumbersome, so I decided early on to use an embedded browser. I considered implementing it myself, with the help of libraries like d3-flamegraph or extending speedscope, but this proved too much work. And I had no experience in building production-ready web applications, or for that matter, React.
Advantages of Firefox Profiler
Here comes the Firefox Profiler: It might seem illogical to use it in a use case that its developers never thought about, but it has a lot going for it:
- it has multiple visualizations and a timeline to select time slices
- it is open-source but backed by a large company
- it is actively developed by a small group of people
- it has a matrix channel where you can ask a lot of questions and get great answers
- it has a well-defined profile format which is rather extensively documented
- its developers were open to collaborating with me, adapting Firefox Profiler for non-web use cases
It has still been a lot of work to add the necessary features for my use case, and it is an ongoing effort to integrate them into the mainline Firefox Profiler. But if the current Firefox Profiler meets all your needs UI-wise, then using it beyond the web is just a matter of writing a profiler.
Just keep in mind that you'll have to map your data onto the profile data structure of Firefox Profiler.
My Java Profiler IntelliJ Plugin
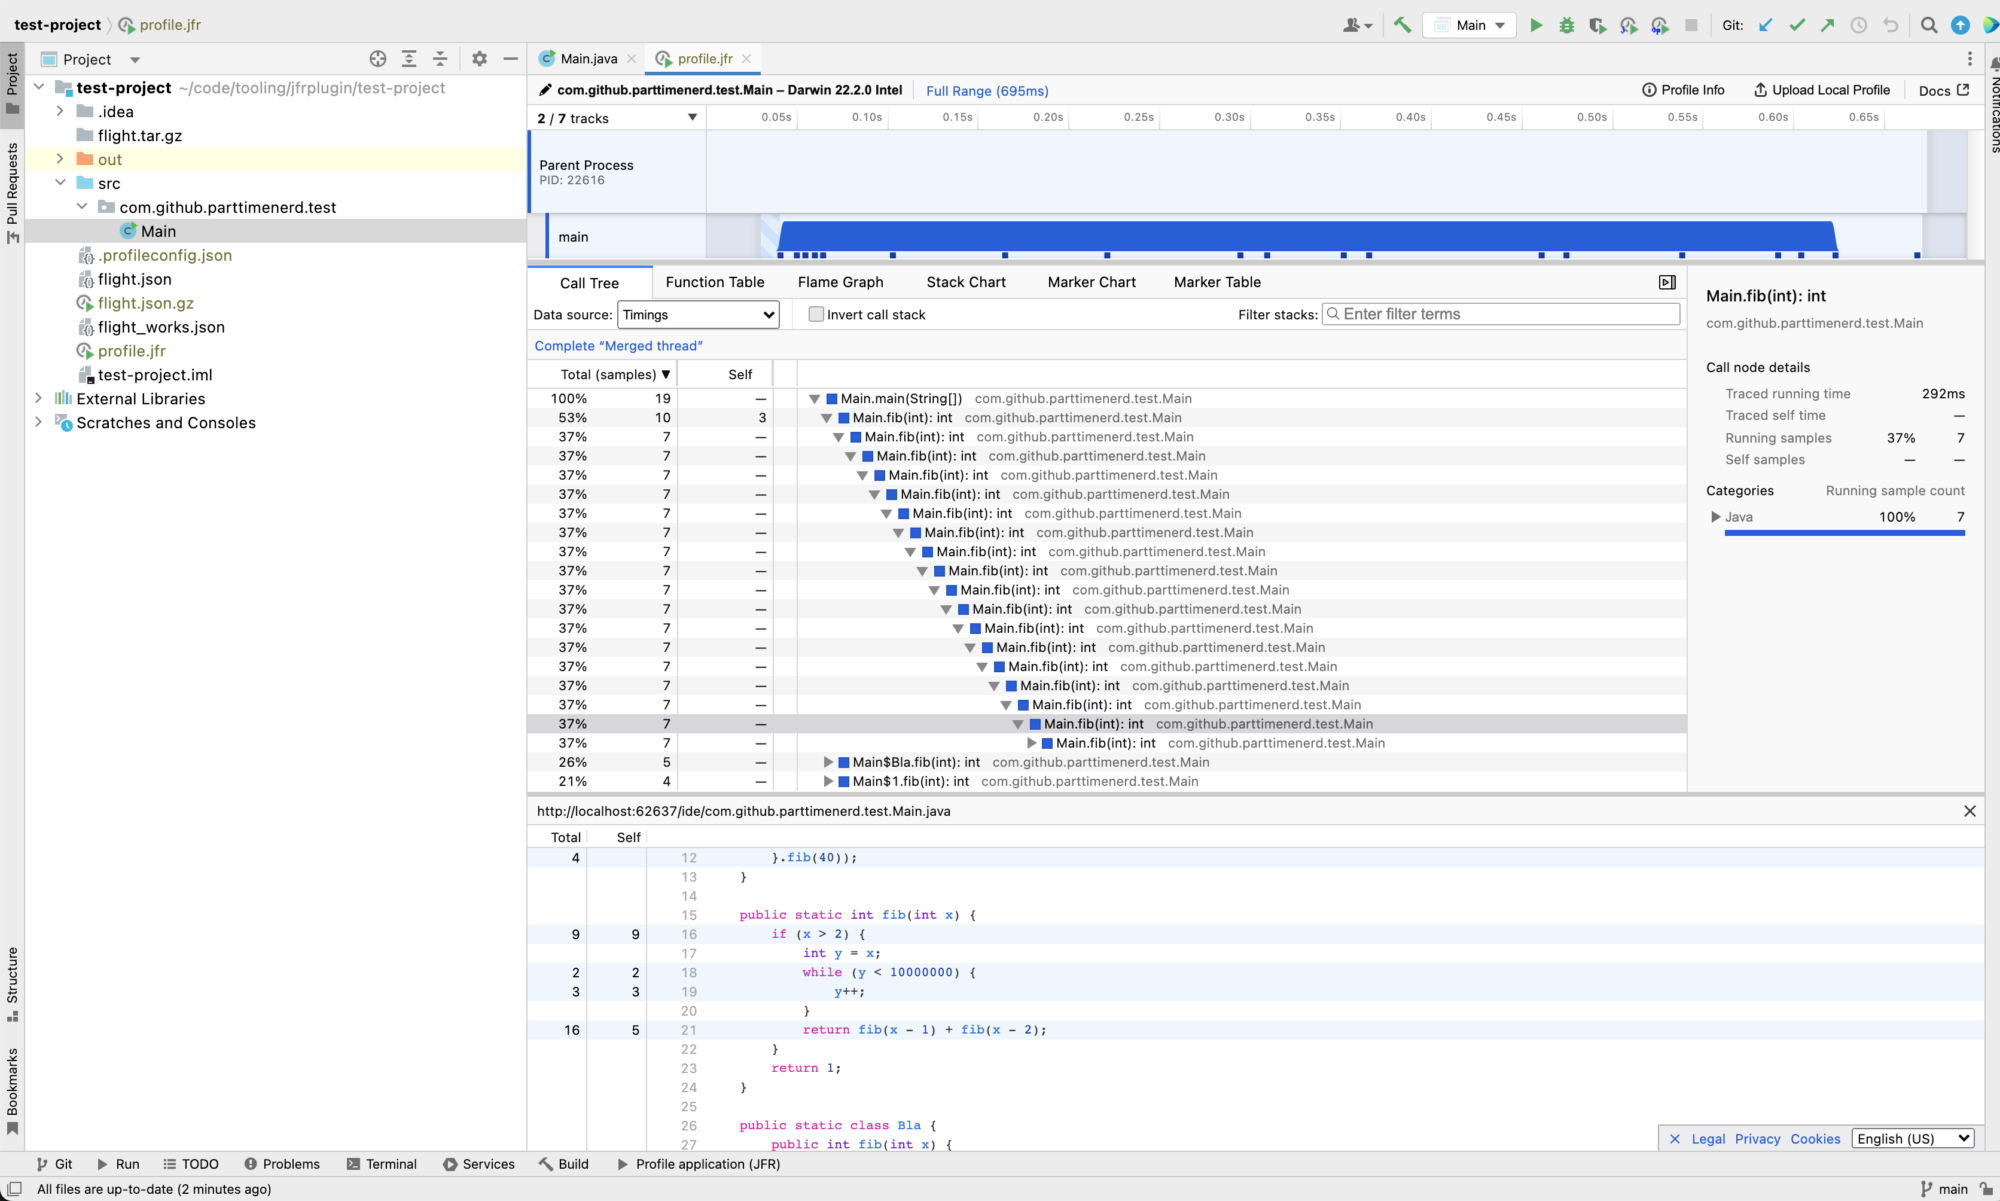
My Java JFR profiler plugin is the result of all my efforts:

It uses my Firefox Profiler fork, which includes additions not yet in the upstream repository and has a modular implementation so that you can use the JFR to Firefox Profiler converter independently. The plugin supports gathering profiles using JFR and async-profiler (via ap-loader), the previous image with the different run configurations is from my plugin, and opening arbitrary JFR files (as long as they are not too large):

The plugin integrates with your IDE, navigating to a method in the source code when you double-click a method in the profile view. Shift double-click, and it shows you the code with the profiling information on the side:

Besides that, it has support for showing information on all JFR events:

The Firefox Profiler view contains a Function Table, Flame Graph, and Stack Chart view, combined with a timeline on top, so it truly solves the first problem of visualizations. And it solves the second problem, as profiling with JFR or async-profiler can't be more accessible than clicking a single button.
The plugin is under active development and currently in the beta stage, so give it a try and feel free to create issues on GitHub. You can pick the Java JFR Profiler plugin from the JetBrains marketplace.
I will write an entire blog post covering the plugin usage in the next few weeks, so stay tuned for more information and possibly a screencast.
I'll release another, more technical blog post in the next few days, which covers other tools that use Firefox Profiler as a visualization and the profile format. This will be the second part of my FOSDEM talk. I hope to see you there or in the stream.
This blog post and the IntelliJ Plugin are part of my work in the SapMachine team at SAP, making profiling easier for everyone. The post appeared first on my personal blog.
- February 02, 2023
- 6 min read


Comments (0)
No comments yet. Be the first.