


How to Identify Dependencies in Your Codebase During Microservices Migration
- June 07, 2024
- 5 min read
Migration from a monolithic architecture to microservices presents challenges, particularly in identifying and managing dependencies within the codebase. By analyzing the application’s training data, we can uncover the seams and threads that bind the application together, discovering a safer, more iterative path to refactor our code.
Table of Contents
- Collecting tracing data to understand code dependencies
- Using Digma Analytic Insights to identify dependencies in your codebase:
- Code Nexus Point Insight
- Top Usage Insight
- Discovering Dead Code
- Duration Breakdown Insight
- Conclusion: Identifying Dependencies in Your Codebase During Microservices Migration
Migration from a monolithic architecture to microservices can be crucial for scalability, flexibility, and development velocity. However, this transformation has challenges, particularly when trying to identify and manage dependencies within the codebase. Many teams optimistically embark on an application-wide modernization epic, thinking of making short work of refactoring their codebase to be more modular. Unfortunately, many of these initiatives quickly lose the initial momentum, as it becomes apparent that untangling the Gordian monolith knot is proving to be an uphill struggle.
The aim of this article is not to dissuade or scare you away from refactoring your code: quite the opposite. Many of these efforts to transform the system architecture get stuck because the efforts are poorly planned or because the complex system architecture is not well understood. Thankfully, observability, a technology often overlooked by developers, can help shine a light through the most dense of code bases. By analyzing the application training data, we can uncover the seams and threads binding the application together and discover a safer, more iterative path to refactor our code.
One of the benefits of Java is that observability is almost free. Significantly, no code changes are necessary and with the right toolings, you can activate advanced tracing almost immediately. Let’s review how this is done:
Collecting tracing data to understand code dependencies
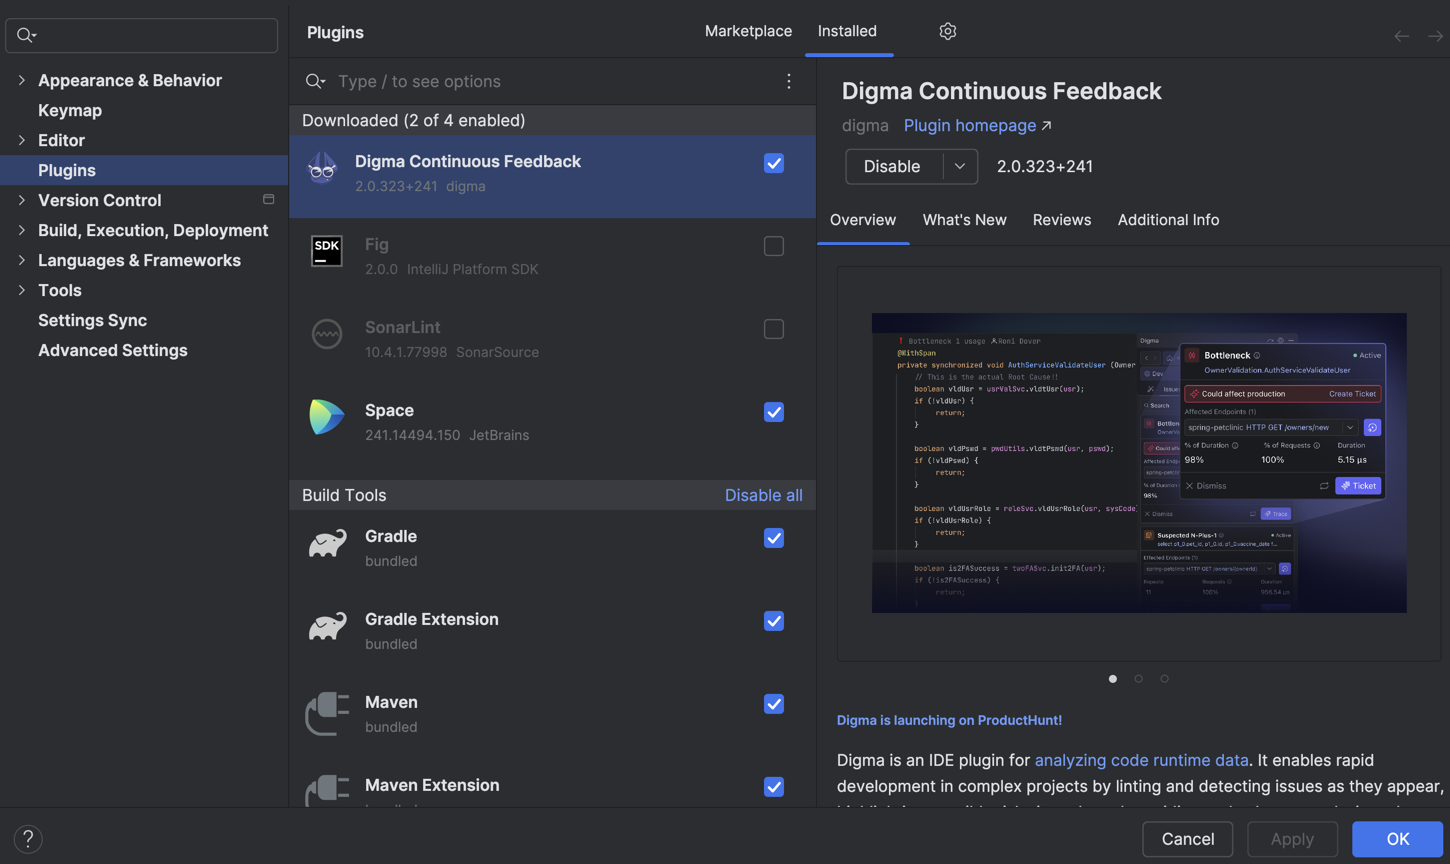
In this example, we’ll be using a developer tool called Digma to collect and analyze the tracing data. Digma is an IntelliJ plugin and uses OpenTelemetry behind the scenes to collect data about the code. To get started, all you have to do is install Digma from the IntelliJ marketplace and run your code. Even locally you can gather a log of data just by activating your code or running tests. You can get even more comprehensive data by connecting Digma with a CI, Staging, or Production environment.
Digma Continuous Feedback plugin
Using Digma Analytic Insights to identify dependencies in your codebase:
As you run your code Digma will start analyzing the tracing data to discover issues, but also come up with useful analytics. There are many types of analytics that Digma can glean but in the context of this post, I’ll review four types of insights that can be extremely useful during your codebase analysis before the migration.
- Code Nexus Point
- Top Usage insight
- Dead code
- Duration Breakdown Insight
Learn more: Here
Code Nexus Point Insight
This insight highlights areas in the code with high levels of runtime dependencies. By identifying these nexus points, developers gain insight into the areas that require meticulous attention and thoughtful refactoring. This insight can help prevent a dependency hell as you refactor your code and better select candidates for extraction into modular components.
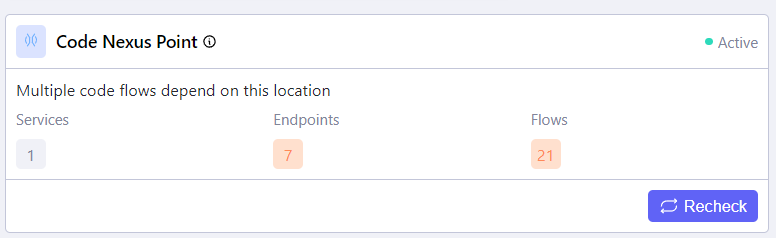
Code Nexus Point Insight
In the example above, we can see that the “Services” property reveals that only one service uses the current method. Based on the intended architecture, we can make that method part of a microservice that uses it. If more than one service uses that method, consider moving that service to a shared module. Look at the image below, which shows three service references.

Top Usage Insight
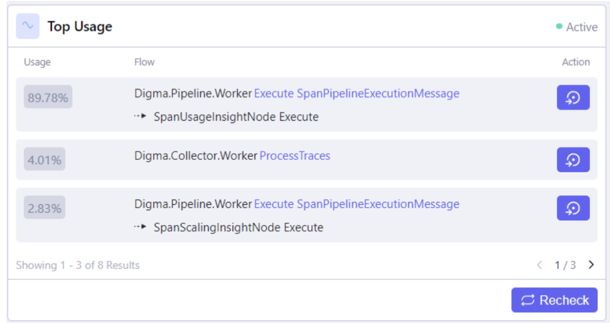
With this insight you see more specific information about how the code is used, we can check the ‘Top Usage’ insight. This can definitely come in handy when dealing with dependencies during a microservices migration. The insight reveals how the code is being used within our application and allows us to navigate those usages without debugging each individual one.
By using this insight, you can see all the places that call your method and their usage rate. Use the traces button to investigate traces in more detail.
Top Usage Insight
Discovering Dead Code
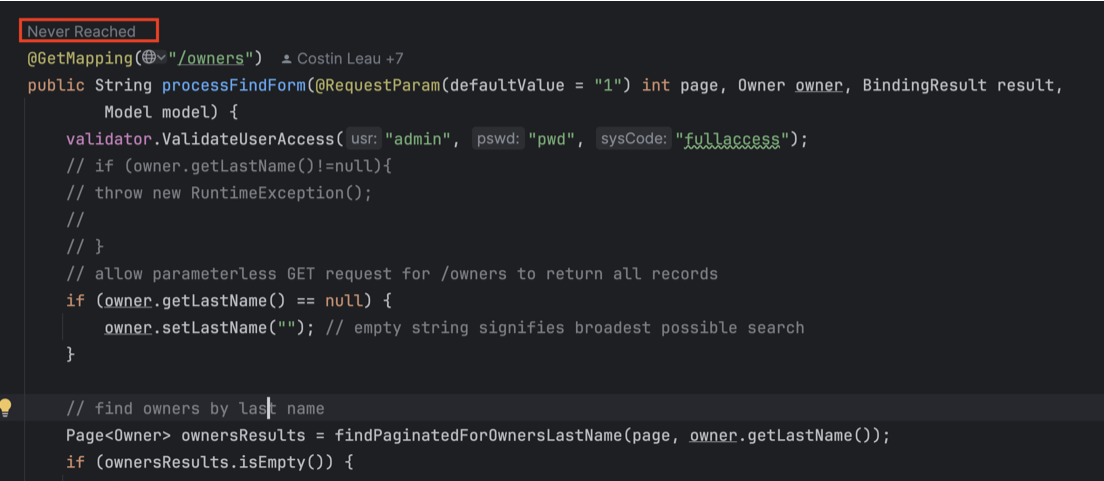
The above insights allow us to reveal important information pieces about how the code is being used – but what if we’re interested in finding code that isn’t used at all?
Digma provides annotations over such areas in the IDE editor to draw your attention to the fact that they are not reached by any flow in the application:
Duration Breakdown Insight
Lastly, for each area in our application, Digma will reveal the Duration Breakdown insight. The value of this information is two-fold. First, it allows us to see not only who uses this code (which we saw in the previous insights) but also which other components this code is calling out to. Next, this insight provides important performance baselines that we can use to detect performance issues before the migration resulting in slow invocations so the migration will go smoother.
Understanding the performance of methods is crucial to microservices migration and will save you a lot of time and frustration. Most likely, it was performance problems that led you to the decision to switch to microservices.

Duration Breakdown Insight
Conclusion: Identifying Dependencies During Microservices Migration
Observability can be the secret sauce to succeeding in large-scale refactoring operations. Complex systems can be unwieldy, closely coupled tangled, and messy. Any tool that can help provide insights, data, and analytics about the code runtime behavior can be invaluable to selecting candidates for refactoring and assessing the scope of change. Combining these four insights as well as other analytics, can provide a better understanding of method behavior and help reach better results in refactoring complex code bases.
Let me know how your refactoring efforts panned out and whether this type of information helped you reach your architecture change goals! Ping me for any questions.
- June 07, 2024
- 5 min read
Senior Software Engineer at Digma


Comments (0)
No comments yet. Be the first.