

Level-up your Java Debugging Skills with on-demand Debugging
- October 16, 2023
- 5 min read
Debugging is one of the most common tasks in software development, so one would assume that all features of debuggers have ample coverage in tutorials and guides.
Yet there are three hidden gems of the Java Debugging (JDWP) agent that allow you to delay the start of the debugging session until...
- you gave orders via
jcmd(onjcmd=yoption) - the program threw a specific exception (
onthrow=<exception>) - the program threw an uncaught exception (
onuncaught=y)
Before I tell you more about the specific options, I want to start with the basics of how to apply them.
Option Application
When you debug remotely in your IDE (IntelliJ IDEA in my case), the "Debug Configurations" dialog tells you which options you should pass to your remote JVM:
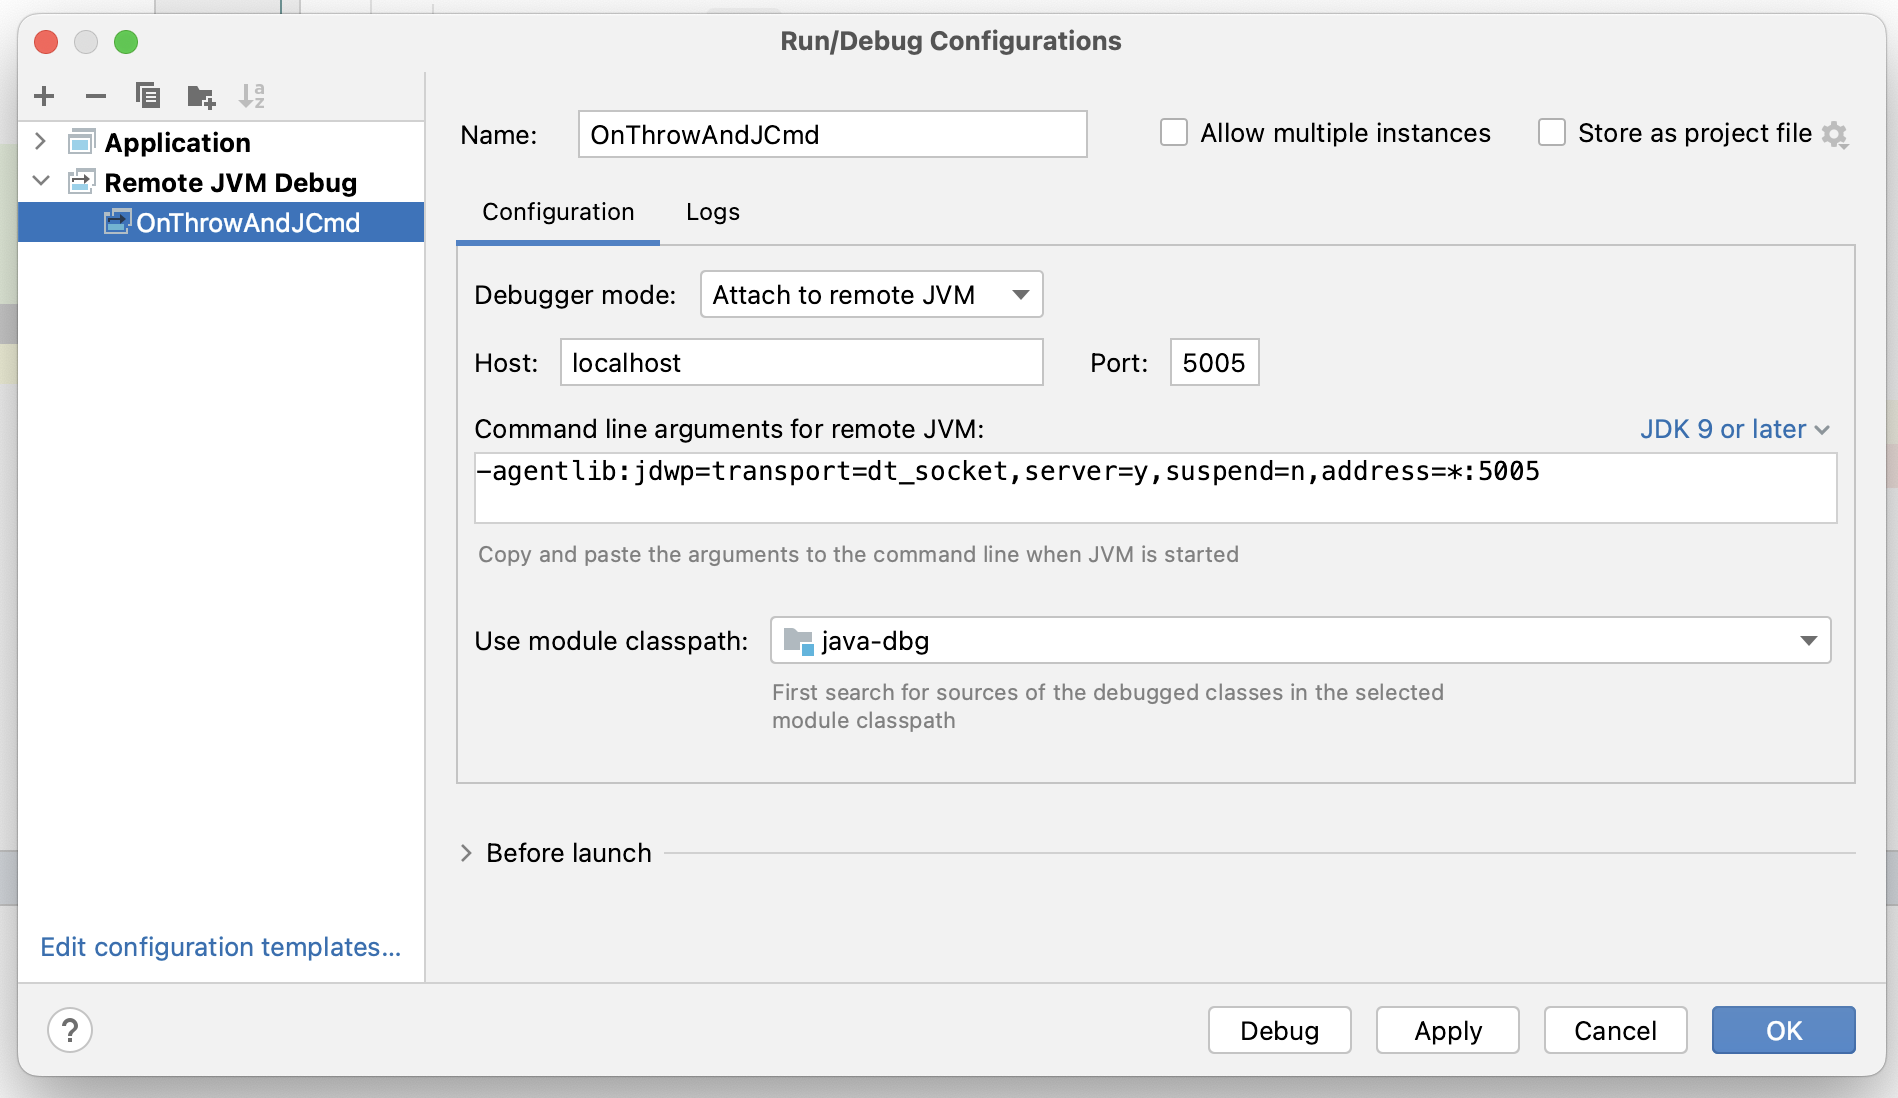
Just append more options by adding them to the -agentlib option, or by setting the _JAVA_JDWP_OPTIONS environment variable, which is comma-appended to the options.
All options only work correctly in the server mode (server=y) of the JDWP agent (suspend=y or suspend=n seem to exhibit the same behavior with onjcmd).
I'm now showing you how the three hidden gems work:
JCmd triggered debugging
There are often cases where the code that you want to debug is executed later in your program's run or after a specific issue appears. So don't waste time running the debugging session from the start of your program, but use the onjcmd=y option to tell the JDWP agent to wait with the debugging session till it is triggered via jcmd:
 ➜ java "-agentlib:jdwp=transport=dt_socket,server=y,suspend=y,address=*:5005,onjcmd=y" src/test/java/OnThrowAndJCmd.java &
 ➜ echo $! # get pid
 # wait some time and then start debugging on demand
 ➜ jcmd $! VM.start_java_debugging
jcmd 97145 VM.start_java_debugging
97145:
Debugging has been started.
Transport : dt_socket
Address : *:5005
jps is your friend if you want to find the process id of an already running JVM.
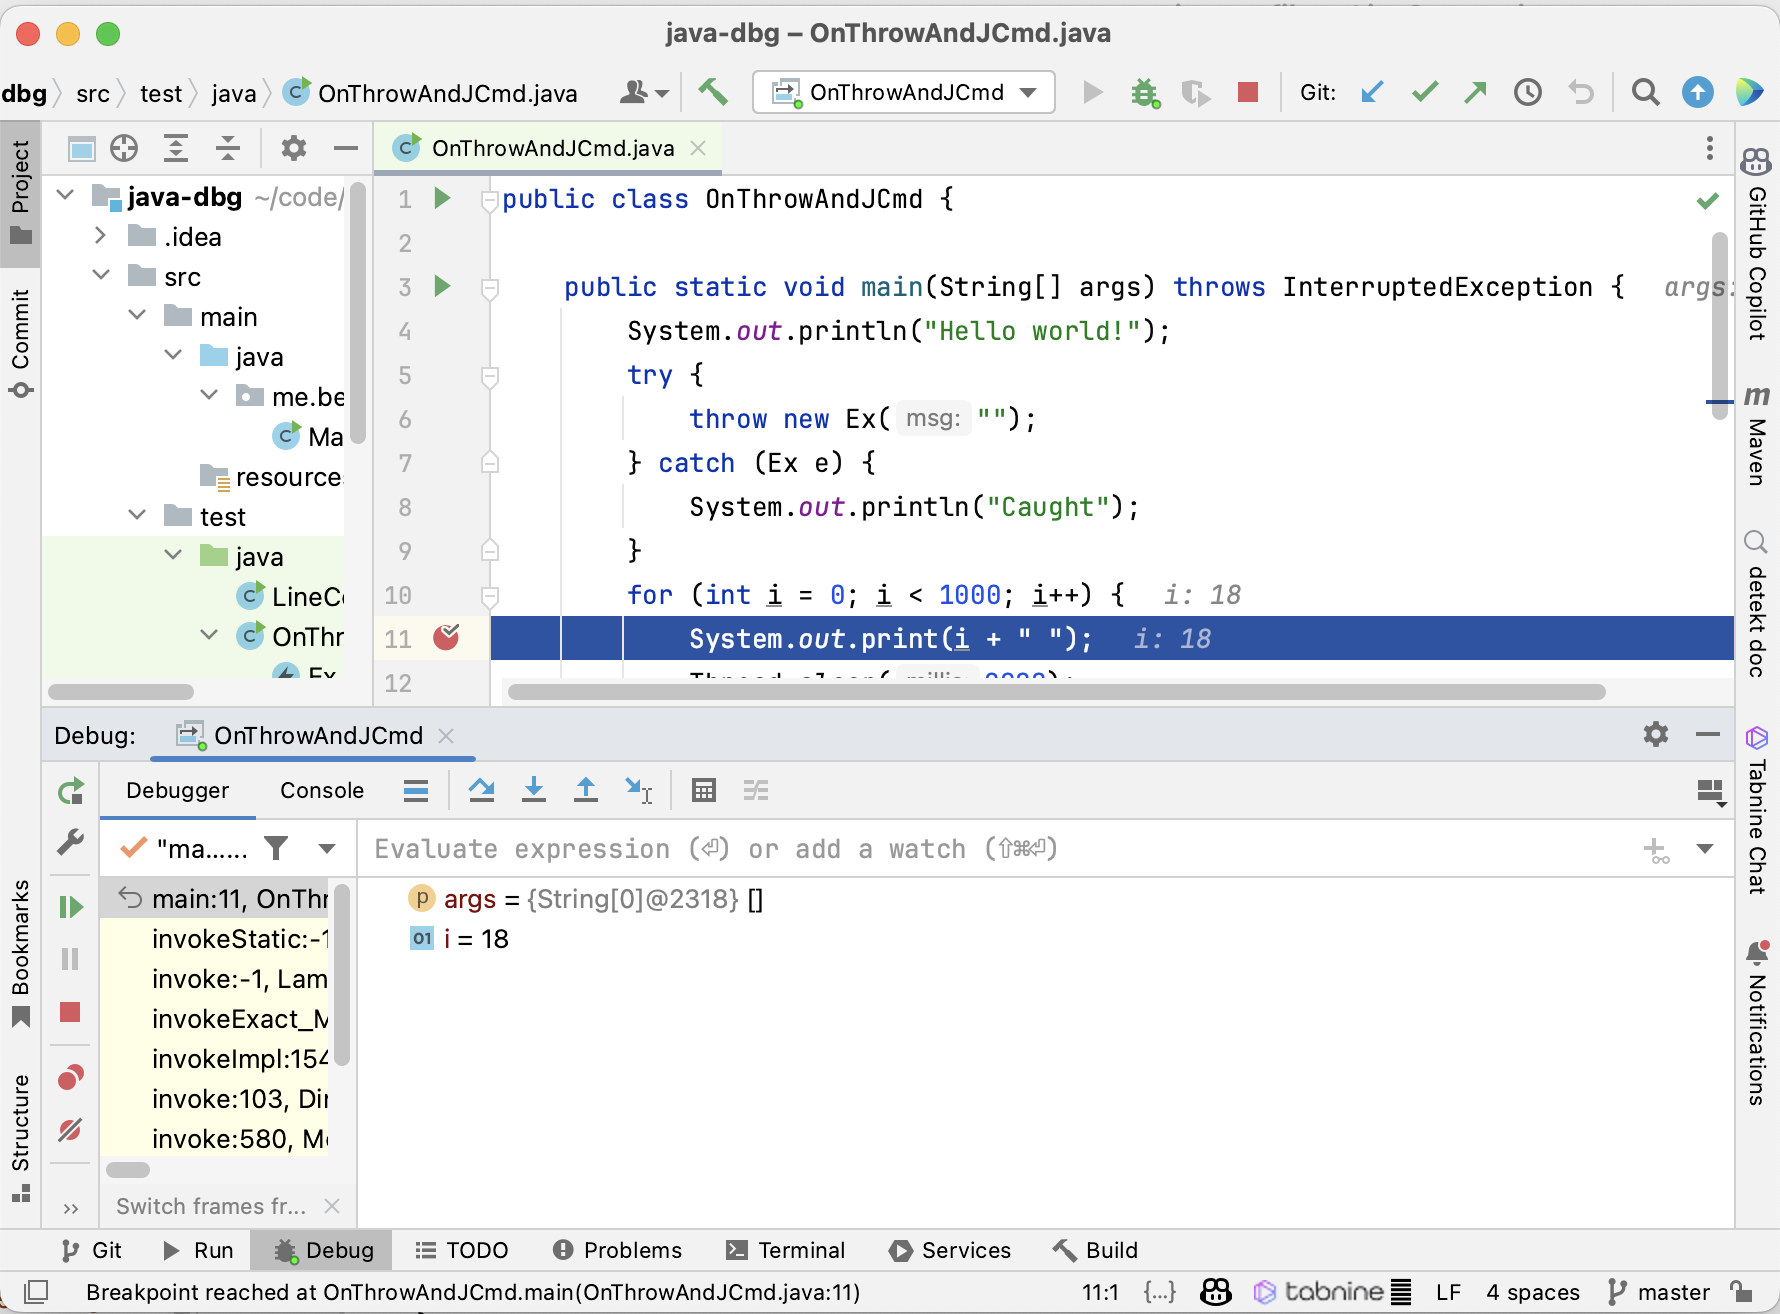
I created a sample class in my java-dbg repository on GitHub with a small sample program for this article. To use JCmd triggered with our IDE, we first have to create a remote debug configuration (see previous section); we can then start the sample program in the shell and trigger the start of the debugging session. Then, we start the remote debug configuration in the IDE and debug our program:
A similar feature long existed in the SAPJVM. In 2019 Christoph Langer from SAP decided to add it to the OpenJDK, where it was implemented in JDK 12 and has been there ever since. It is one of the many significant contributions of the SapMachine team.
Disclaimer: I'm part of this magnificent team, albeit not in 2019.
Exception triggered debugging
Far older than jcmd triggered are exception-triggered debugging sessions. There are two types:
- The throwing of a specific exception (byte-code or normal name, inner classes with
$) can start the debugging session by usingonthrow=<exception>.This is especially nice if you want to debug the cause of this specific exception. This feature can easily be used in combination with your favorite IDE. - The existence of an uncaught exception can trigger the start of a debugging session by using
onuncaught=y. The debugging context is your outermost main method, but it's still helpful if you want to inspect the exception or the state of your application. A problem is that you cannot use the debuggers from IntelliJ IDEA or NetBeans to explore the context; you have to use the command line debuggerjdbinstead.
Due to historical reasons, you also have to supply a command that is executed when the debugging session starts via the launch option, but setting it to exit works just fine.
Using both trigger types is similar to the JCmd triggered debugging:
 ➜ java "-agentlib:jdwp=transport=dt_socket,server=y,suspend=y,address=*:5005,onthrow=Ex,launch=exit" src/test/java/OnThrowAndJCmd.java
# or
 ➜ java "-agentlib:jdwp=transport=dt_socket,server=y,suspend=y,address=*:5005,onuncaught=y,launch=exit" src/test/java/OnThrowAndJCmd.java
If you're okay with using jdb, you can also use the launch option to call a script that starts jdb in a new tmux session, in our case, tmux_jdb.sh:
#!/bin/sh
tmux new-session -d -s jdb -- jdb -attach $2
We run our application using the JDWP agent with the onthrow=Ex,launch=sh tmux_jdb.sh option to start the jdb the first time the Ex exception is thrown and attach to the tmux session:
➜ java "-agentlib:jdwp=transport=dt_socket,server=y,suspend=y,address=*:5005,onthrow=Ex,launch=sh tmux_jdb.sh" src/test/java/OnThrowAndJCmd.java
# in another console after the exception is thrown
➜ tmux attach -t jdb
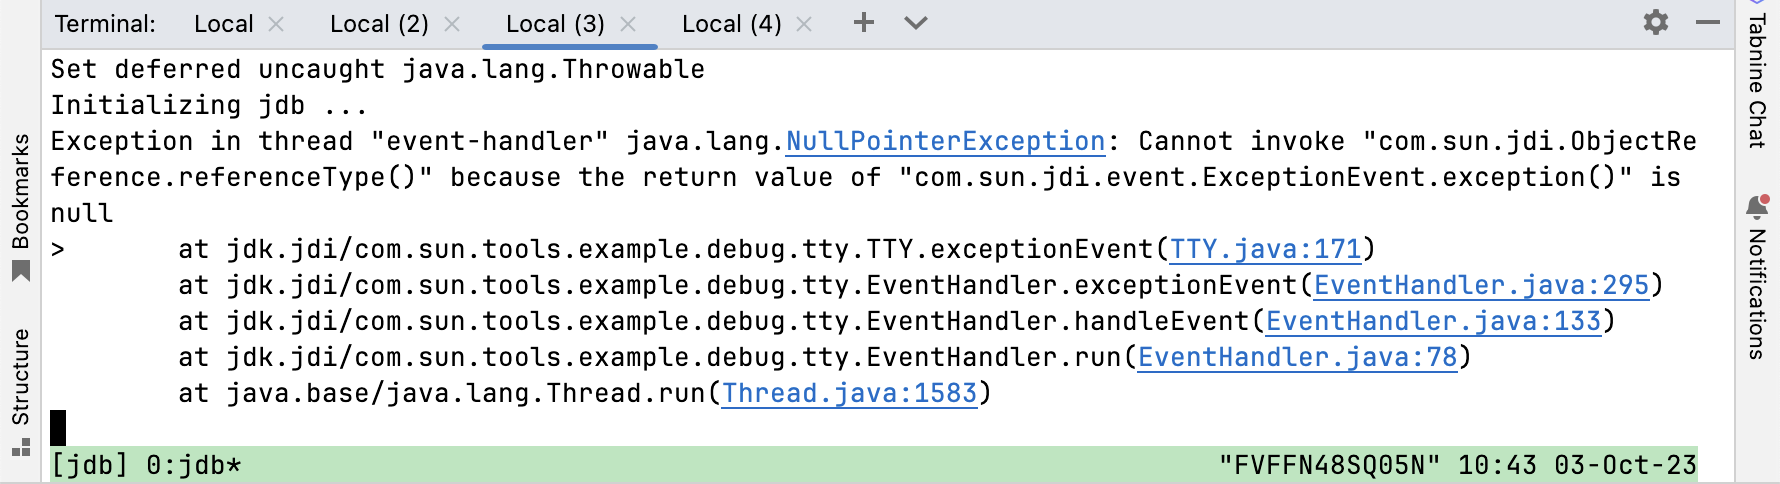
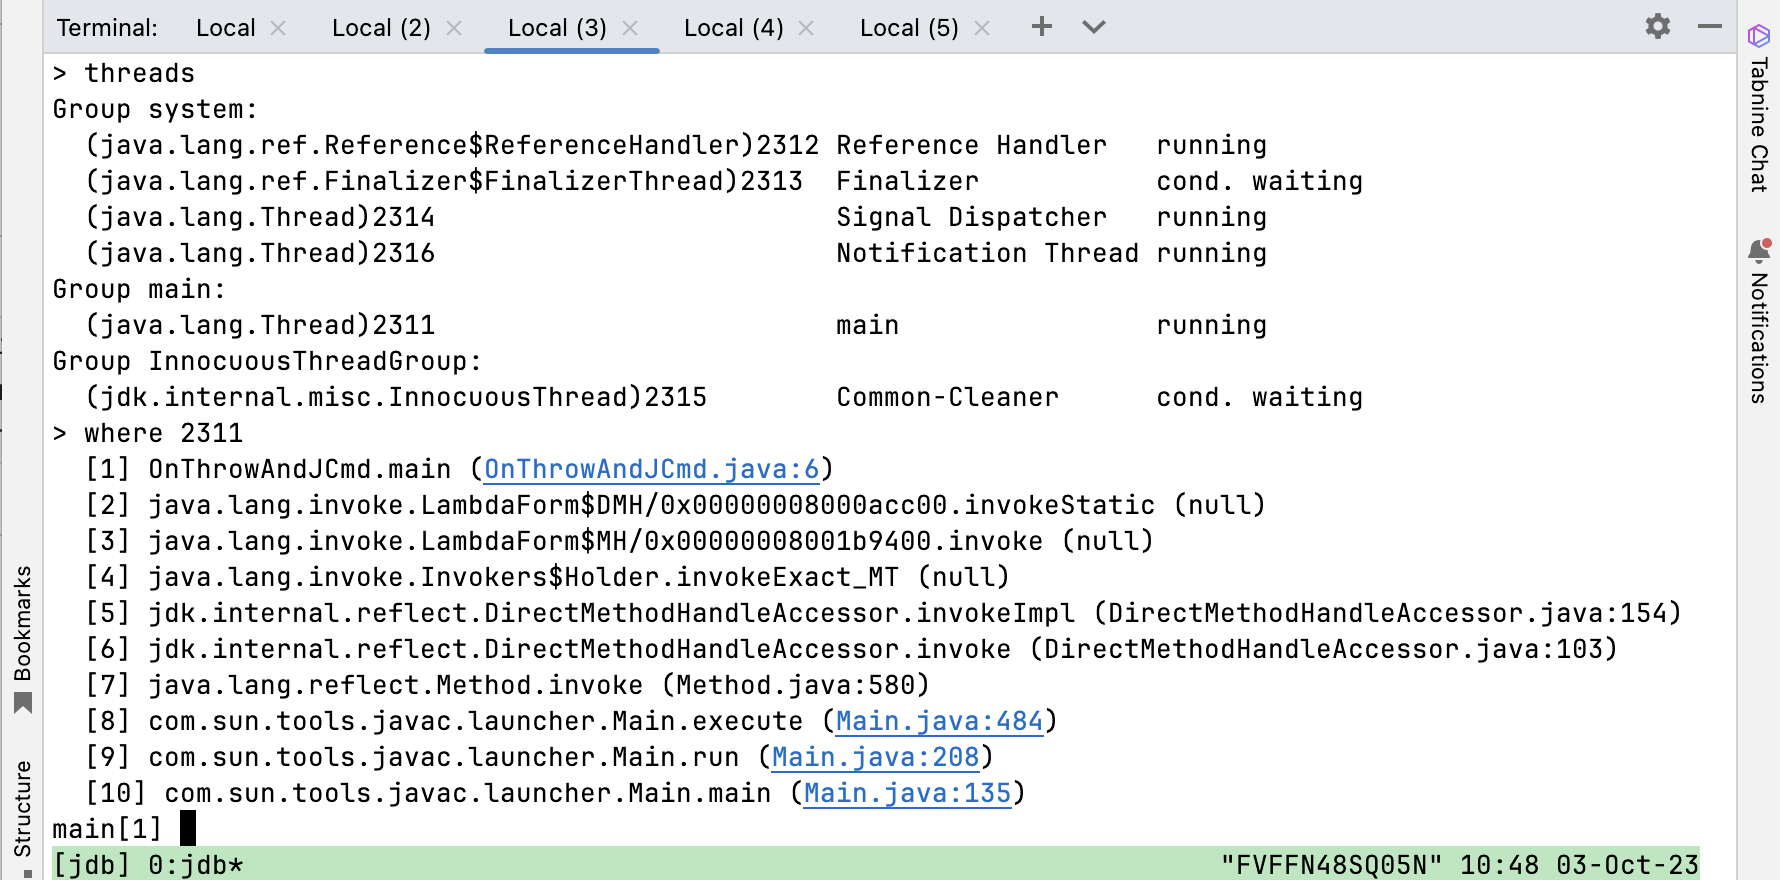
Where we can explore the current state of the application:
Debugging a specific exception has never been easier.
jdb and the JDWP on* options aren't as widely used as graphical debuggers, so you might still find some bugs. I don't know whether the stack trace in the second-to-last screenshot is a bug. Feel free to comment if you know the answer.
How to discover these features
You can either be like me and just drop into the JDK source and look into the debugInit.c file, the official documentation, or you use help option, which prints the following with JDK 21:
➜ java "-agentlib:jdwp=help"
               Java Debugger JDWP Agent Library
               --------------------------------

  (See the "VM Invocation Options" section of the JPDA
   "Connection and Invocation Details" document for more information.)

jdwp usage: java -agentlib:jdwp=[help]|[<option>=<value>, ...]

Option Name and Value            Description                       Default
---------------------            -----------                       -------
suspend=y|n                      wait on startup?                  y
transport=<name>                 transport spec                    none
address=<listen/attach address>  transport spec                    ""
server=y|n                       listen for debugger?              n
launch=<command line>            run debugger on event             none
onthrow=<exception name>         debug on throw                    none
onuncaught=y|n                   debug on any uncaught?            n
onjcmd=y|n                       start debug via jcmd?             n
timeout=<timeout value>          for listen/attach in milliseconds n
includevirtualthreads=y|n        List of all threads includes virtual threads as well as platform threads.
                                                                   n
mutf8=y|n                        output modified utf-8             n
quiet=y|n                        control over terminal messages    n

Obsolete Options
----------------
strict=y|n
stdalloc=y|n

Examples
--------
  - Using sockets connect to a debugger at a specific address:
    java -agentlib:jdwp=transport=dt_socket,address=localhost:8000 ...
  - Using sockets listen for a debugger to attach:
    java -agentlib:jdwp=transport=dt_socket,server=y,suspend=y ...

Notes
-----
  - A timeout value of 0 (the default) is no timeout.

Warnings
--------
  - The older -Xrunjdwp interface can still be used, but will be removed in
    a future release, for example:
        java -Xrunjdwp:[help]|[<option>=<value>, ...]
Of course, this only gives you a glance at the options, so reading the source code still revealed much of what I had before.
Conclusion
Hidden gems are everywhere in the Java ecosystem, even in widely used tools like debugging agents.
Especially onthrow and onjcmd can improve the performance of on-demand debugging, as this allows us to trigger the start of the debugging session from outside the debugger.
I hope you can apply your newly gained knowledge the next time you have a complex problem to debug. Still curious about debugging? Come back next week for deep dive on the onthrow option.
This article is part of my work in the SapMachine team at SAP, making profiling and debugging easier for everyone. Thanks to Thomas Darimont, with whom I discovered the hidden features while preparing for my talks on Java Debugging. I wrote this article on the train to Devoxx Belgium. It first appeared on my personal blog mostlynerdless.de.
- October 16, 2023
- 5 min read
A JVM developer working on profilers and their underlying technology, e.g. JEP Candidate 435, in the SapMachine team at SAP.


Comments (1)
Koosha
3 years agoRegarding the bug mentioned in the article (the unexpected stacktrace): https://mostlynerdless.de/blog/2023/10/11/jdwp-onthrow-and-a-mysterious-error/?lidx=18&wpid=402882