

Monitoring Spring Boot Applications (Part 1)
- January 12, 2022
- 4 min read
In part 1 of this series, we will learn about JDK Flight Recorder and how we can use it to monitor a Spring Boot application.
Introduction
Application monitoring is one thing that we as developers cannot overlook. It doesn’t matter if you run a monolith or microservices application because application monitoring is a must for production workloads to know what’s happening with your application. If you are using Spring Boot, there are different ways to monitor an application. The most popular way to monitor a Spring Boot application is to enable the spring-boot-actuator module to achieve the desired result.
More often than not, we rely on third-party tools like Appdynamics, Dynatrace, Prometheus, and Grafana to monitor our workloads. But what if I told you that you could use a tool that comes with JDK to monitor your Spring Boot applications. Could you not believe me yet? Let me introduce you to the JDK flight recorder in this article that we will use to monitor a Spring Boot application.
What is a JDK Flight Recorder?
JDK Flight Recorder is a diagnostic tool that collects events of running Java applications, JVM and OS.
JFR was a commercial feature earlier, but it has been open-sourced and made GA from OpenJDK 11 onwards. See this JEP. If you are stuck on JDK 8 like everyone else, then no worries as it seems, the work is completed to backport it to OpenJDK 8. There is no need to download it separately as JFR comes bundled with your JDK.
JDK Flight Recorder Features
- You can analyze the recordings offline.
- View detailed information on memory usage, garbage collection, hot methods and classes, threads, Java locks, and more.
- Minimal impact on performance(<1%).
- It can store events on disk and memory as well.
- Create customized events as per your need with API.
- Support for Event Streaming from OpenJDK 14 onwards.
Enabling JDK Flight Recorder
- Using Command-line
- Using jcmd tool
- Using JMC
Let’s understand these options in detail.
Using Command-line
If you are using OpenJDK 11 or higher version, you can enable flight recorder by passing the flag -XX:StartFlightRecording while starting your Spring Boot or Java applications. Since you can pass the flag at an application startup, it is good to rely on JFR for your application monitoring. Following is the example:
java -XX:StartFlightRecording:filename=myrecording.jfr,duration=60s -jar myapp.jar
In this example, after enabling JFR, the data is dumped to myrecording.jfr file and analyzed using a client-side tool JDK Mission Control. JMC has to be downloaded separately as it’s not part of your JDK. It is available for download from here.
Using jcmd tool
Suppose you don’t always want JFR to monitor your application as discussed in the first option but only want to diagnose when any issue occurs. In that case, jcmd is a handy option as it will send diagnostic commands to running Java applications. You have to pass the PID of the running java process or the main class and the actual command.
jcmd 24597 JFR.start duration=60s filename=myapprecording.jfr
In the above example, we have started JFR recordings for 60-seconds on the running Java process with the PID 24597 and saved it to myapprecording.jfr file in the current directory. To view all the available commands for a running Java application, specify jcmd help. Following are some of the commands that we can use with jcmd.
jcmd 24597 help

24597:

The following commands are available:

JFR.check

JFR.configure

JFR.dump

JFR.start

JFR.stop
Here is a summary of those commands: https://gist.github.com/yrashish/0fb966ef0294a5c336e9253ba78effe7
Using JMC
JDK Mission Control aka JMC is a GUI tool for examining the recording created by JFR. Not just that with JMC you can start recording events of a running java process. As shown in the following screenshot from the left-hand side navigation bar in JMC first you have to choose a running java process. Then right-click and choose Start Flight Recording.
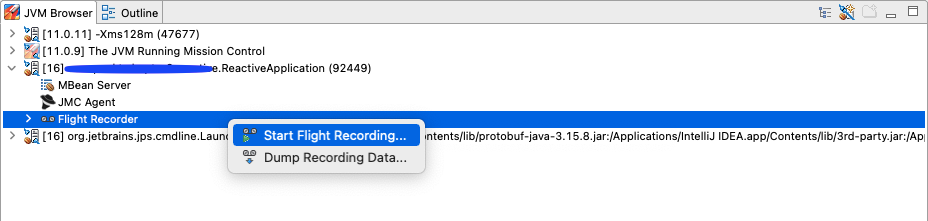
Start Flight Recording
In the next window, you can go with default options or tweak them as per your needs. Then click on Finish to start the recording of events for the Spring Boot application.

Once the recording is finished automated analysis results are shown.
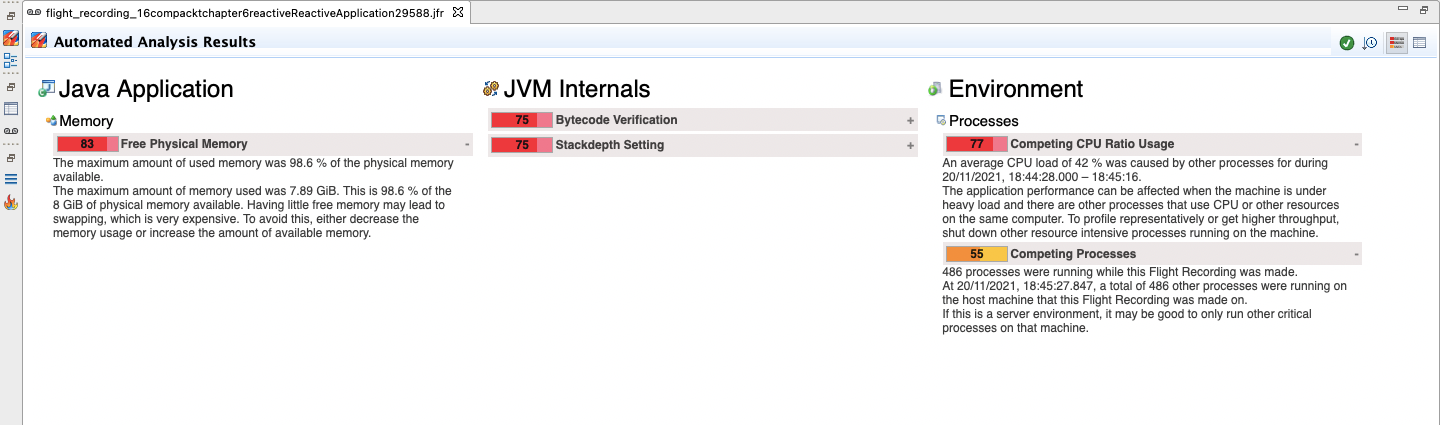
Automated Analysis Results
As shown in the following screenshots you can also view Java application Threads, Heap, and CPU-related details. Moreover, you can also view JVM Internals and Environment related details.
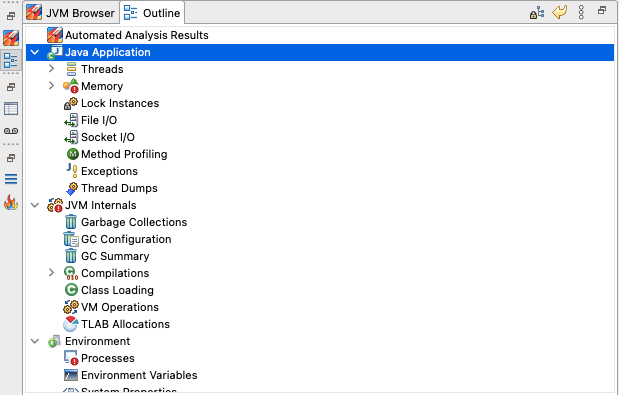
Options to view results by different categories
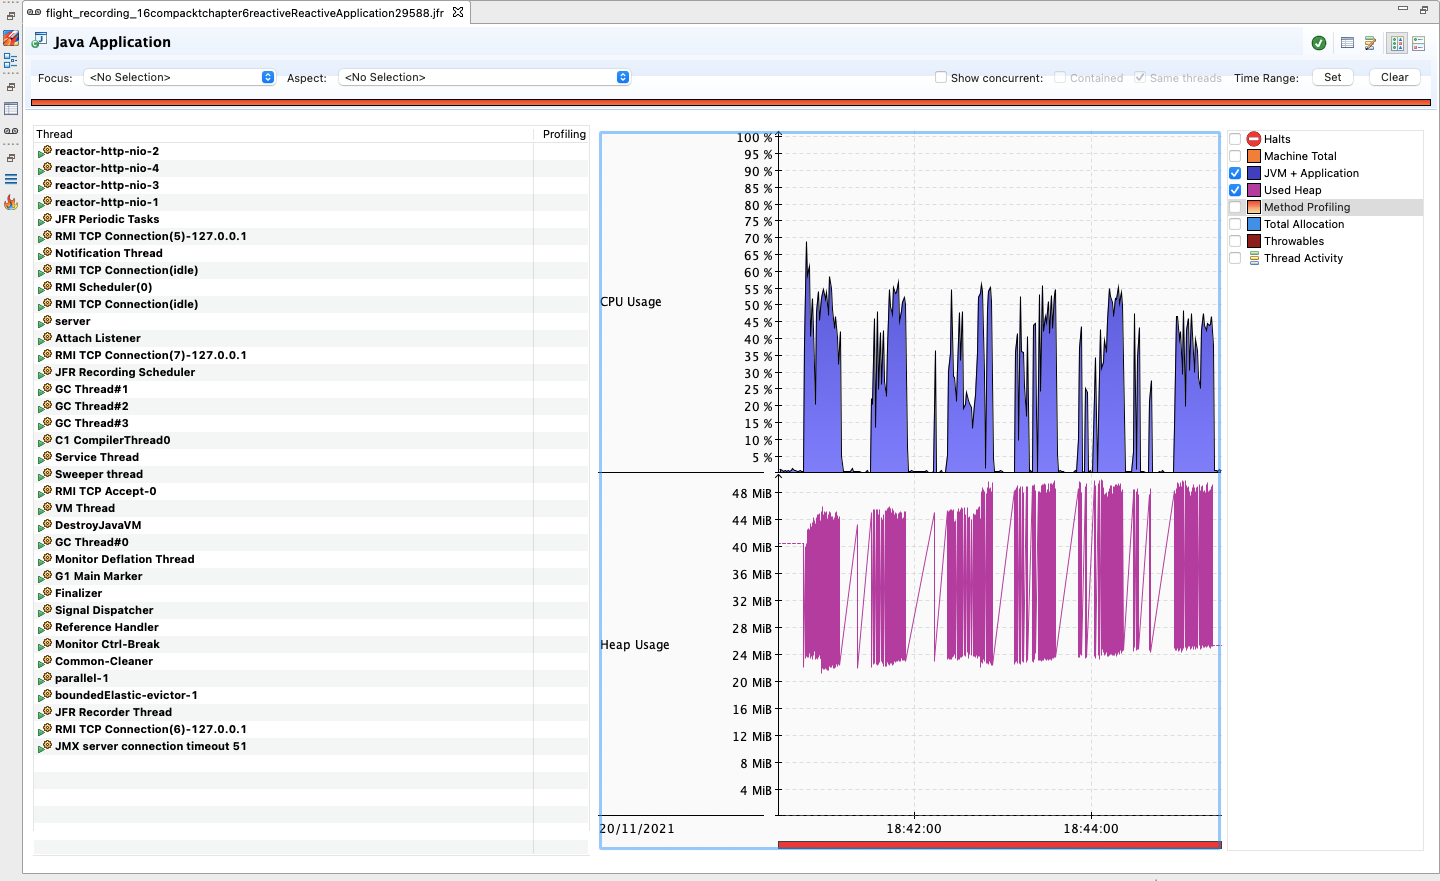
Java Application Thread, CPU and Heap Usage
That’s it we are done.
Conclusion
In this article, we have only covered how we can enable and use the JDK flight recorder to monitor a Spring Boot application. JDK flight recorder is a reasonable tool for monitoring application performance.
Having said that in part 2 of this series, we will try to monitor simple spring boot application startup events with JFR. We will also understand how we can use JFR event streaming to continuously monitor a Spring Boot application.
- January 12, 2022
- 4 min read
I am a software engineer and technical writer who loves Java, Spring Boot, DevOps, and the Cloud.


Comments (1)
Nils
4 years agoDid you already finish the mentioned part 2 of the series and will you link it here?