

Observability for JVM Frameworks with Grafana in Java and Kotlin
- March 30, 2022
- 9 min read
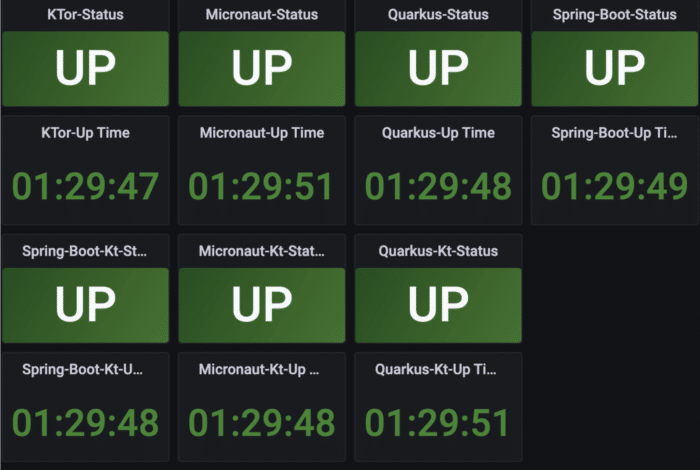
Grafana dashboard for all running frameworks
Introduction
In times of Cloud and distributed applications, it is becoming more and more important to be able to evaluate a functionality at runtime, an aspect which is referred to as observability.
A Cloud-based application is usually set up as a collection of different subsystems that may be located in one or more network zones or machines. These subsystems communicate with each other by passing messages (signals) and executing desired actions to each other. The whole collection then appears to the end user as a single coherent system.
The fact that an application is divided into subsystems influences deployment strategies and raises requirements on the proper configuration. Observability may become a crucial feature here also as it serves the information of properly executed steps and statuses.
In this article we review monitoring abilities for different JVM based frameworks (Quarkus, Spring, KTor, and Micronaut) by using popular open source, such as Grafana, Prometheus, and Micrometer.
The article focuses on utilising metrics and provisioning subsystem data to the Grafana dashboard, which provides an end-user visualisation of queried data-points, as we discover later below.
The article explores the configuration and libraries required over the selected frameworks by using two different JVM languages, namely Java and Kotlin.
Sample Scenario
For the purposes of this article, a simple application scenario has been created that will be referred to throughout this article.
Each subsystem of this application will provide the same endpoints and metrics. The measured data-points from each application are transmitted to the Grafana dashboard.
Each subsystem contains simple counters for each of its exposed endpoints. These counters provide better insight into the application behavior and may contribute to more detailed application monitoring.
Each application build is provided as a separate Docker image and all Docker nodes run in the same isolated network by using Docker Compose.
The code is available on GitHub:
https://github.com/mirage22/fw-monitoring-examples
Tools
Most probably the best open-source solution that’s able to visualize data points is Grafana. Grafana allows for the creation of very useful graphical dashboards with the utilization of mathematical and statistical functions. Grafana also provides a very neat alerting system and can be connected with various types of databases, out of the article scope.
For recording data points that can be later displayed in a Grafana dashboard, there’s another very commonly used open-source tool called Prometheus. The great strength of Prometheus is that it allows the recording of "real-time" metrics in a time series.
A tool that provides a facade over the Prometheus instrumentation and makes it possible to expose the metrics to Grafana is the Micrometer project. It serves content for a nice endpoint, “/metrics” that is consumed by the Grafana API.
Having all parts of the puzzle lined up to get usage data drained from JVM based applications, we can transmit them to the Grafana dashboard. Maybe it is meaningful to mention the key difference between the Prometheus and Grafana tools as both of them are capable of displaying metrics:
- Prometheus is used for collecting rich metrics and comes with a powerful query language, but it has limits in scaling across multiple services and handling high availability scenarios.
- Grafana is designed to visualize metrics from different sources and enforce availability of the data.
Enabling Metrics for Java Frameworks
Popular Java frameworks were selected to represent the Java language in the examples that follow. The following section describes in more detail the initiation of the metrics.
1. Quarkus on Java
To initiate a metric for the quarkus framework it’s required to import the following library: “io.quarkus:quarkus-micrometer-registry-prometheus”.
When the library is present on the class-path or the module-path it allows to instantiate a bean which holds the reference to the registry, “PrometheusMeterRegistry”. Such a registry represents a singleton (Example 1.) in the running JVM process . It allows the creation of counters (Example 2.)
public class PrometheusMeterRegistryProducer {
   @Produces
   @Singleton
   @AlternativePriority(Interceptor.Priority.APPLICATION + 100)
   public PrometheusMeterRegistry
Example 1. Singleton bean instantiation
MainController(final PrometheusMeterRegistry registry, final HelloService helloService) {
   this.registry = registry;
Example 2. Injecting “PrometheusMeterRegistry” bean and creating counters
2. Spring-Boot on Java
The Spring framework provides an inversion of control (IoC) pattern as a dependency injection pattern utilization.
The application requires the following libraries: “io.micrometer:micrometer-registry-prometheus“ and “io.micrometer:micrometer-core” present on the class or module path.
Similar to the previous example the “PrometheusMeterRegistry” is instantiated as a singleton bean using the auto configuration functionality (Example 3.).
@Autowired
public MainController(PrometheusMeterRegistry registry, HelloService helloService) {
   this.registry = registry;
Example 3. Injecting the “PrometheusMeterRegistry” as a Bean
3. Micronaut on Java
The last micronaut example follows a similar process as the quarkus example. The “PrometheusMeterRegistry” Bean is instantiated through the singleton factory “PrometheusMeterRegistryFactory” and injected to the example “MainController” (Example 4.).
Next to that the Micronaut framework requires to have the following libraries on its class or module path: “io.micronaut.micrometer:micronaut-micrometer-core” and “io.micronaut.micrometer:micronaut-micrometer-registry-prometheus”.
public MainController(PrometheusMeterRegistry registry, HelloService helloService) {
   this.registry = registry;
Example 4. Injecting “PrometheusMeterRegistry “ to the “MainController”
Enabling Metrics for Kotlin Frameworks
The following section provides additional details on how to enable metrics for the selected Kotlin frameworks.
As you may have already noticed, the Kotlin versions of the Java selected ones (Quarkus) were considered as good candidates with an additional one: a pure Kotlin based framework called KTor, with its dependency injection implementation using a project called Koin.
1. KTor
Let’s start with the pure Kotlin one. KTor serves an ability to develop asynchronous HTTP clients or servers. To enable dependency injection we import another library.
Project Koin enables dependency injection functionality for us here, but, of course, it is not required. By having both Ktor and Koin it’s possible to create a simple service that is injected in a similar manner as all other examples.
To enable a metrics endpoint it is required to add following libraries into the class or module paths: “io.ktor:ktor-metrics-micrometer” and “io.micrometer:micrometer-registry-prometheus”. In the case of KTor a new “KoinComponent” (Example 5.) is created called “MetricsService'' and initiated as a module at the application init phase.
This should ensure there’s only one instance presence in the KTor app context. The component “MetricsService” holds the reference to the “PrometheusMeterRegistry” (Example 6.)
fun Application.module(testing: Boolean = false) {
  install(Koin) {
   modules(
       listOf(
           module {
               single { MetricsService() }
           }
       )
   )
Example 5. installation and initiation the “MetricService” component
val registry = PrometheusMeterRegistry(PrometheusConfig.DEFAULT)
.apply{config().commonTags("application", APP_NAME)}
Example 6. Initiation of the Prometheus registry and providing a reference
2. Quarkus on Kotlin
The Kotlin version of the Quarkus framework requires on the class/module path the following library “io.quarkus:quarkus-micrometer-registry-prometheus”.
After that it’s possible, for example, to inject through the constructor the already instantiated “PrometheusMeterRegistry” bean (Example 7). Just as a side note, the prometheus bean is a singleton and refers to the Java implementation. This causes no issues as the compiled byte-code is compatible.
@Path("/")
class MainController @Inject constructor(
       private val registry: PrometheusMeterRegistry,
       private val halloService: HalloService)
Example 7. Prometheus registry constructor injection
3. Spring Boot on Kotlin
Similar to the spring-boot java version it’s required to import both libraries: “io.micrometer:micrometer-core” and “io.micrometer:micrometer-registry-prometheus”. By having the libraries imported the registry is automatically initiated through the AutoConfiguration internal process (Example 8.)
@RestController("/")
class MainController(private val helloService: HelloService, private val registry: PrometheusMeterRegistry) {
Example 8. Injecting “PrometheusMeterRegistry” in the controller constructor
4. Micronaut on Kotlin
The initiation of the “PrometheusMeterRegistry” does not differ too much from the previous example. Similarly as in the Java version it’s required tomport the two libraries “io.micronaut.micrometer:micronaut-micrometer-core” and “io.micronaut.micrometer:micronaut-micrometer-registry-prometheus“. The “PrometheusMeterRegistry“ bean is initiated at runtime as the singleton (see Example 9).
@Controller
class MainController(private val registry: PrometheusMeterRegistry, private val helloService: HelloService) {
Example 9. Injecting registry to the main controller
Creating and Exposing Custom Counters and More
Each considered scenario is intended to be very trivial and similar across different frameworks to help for a complete picture of the Micrometer instrumentation wrapper “Counter” class.
Of course, Micrometer contains more wrappers such as: Gauge, Clock, Timers, LongTaskTimers, DistributionSummary and others but this is out of the article scope.
Each application exposes the following endpoint (Tab.1). Some of them provide a custom counter which serves data to the previously initiated registry.
| Method Type | Path | Http Status | Note |
| GET | / | 200 | Root, displays message, root-tag: main-counter |
| GET | /{name} | 200 | Display message with name, root-tag: name-counter |
| GET | /test/test | 404 | Not available path |
| GET | /metrics | 200, excluded | Exposed metrics with counters |
Table 1. Considered endpoints for the simulation with the counters and appropriate tags that are present inside the metrics
Each newly created counter contains appropriate tags. Such tags help in identification during the creation of the Grafana dashboard, they also help to customize and aggregate results. Each application contains two counters with similar core tags (Tab 1) but there are additional tags added by the application to distinguish the belongingness (Example 10.)
hello_counter_total{application="quarkus-kt",} 1.0
hello_counter_total{application="spring-boot-kt",} 1.0
name_counter_total{application="spring-boot-kt",name="magic",} 1.0
name_counter_total{application="micronaut",name="magic",} 1.0
Example 10. Example of the metrics output for the custom counters
1. Java Counters
All Java frameworks use almost similar implementations that differ only by the framework tag name. The name counter is partially provided by the builder pattern where the tag is added when the “name” variable is known (Example 11). It means when the request arrives the application (Example 12).
this.helloCounter = registry.counter("hello-counter", "application", "<FRAMEWORK_NAME>");

this.nameCounterBuilder = Counter.builder("name-counter").tag("application", "<FRAMEWORK_NAME>");
Example 11. Counters initiation
private Counter getNameCounter(String name) {
   return counters.computeIfAbsent(name, (k) -> nameCounterBuilder.tag("name", k).register(registry));
}
Example 12. Initiate a name counter on demand
2. Kotlin counters
Kotlin counters follow exactly the similar structure as their Java brothers (see, Example 13).
private val helloCounter = registry.counter("hello-counter", "application", "spring-boot-kt")
counters.getOrPut(name) {
   nameCounterBuilder.tag("name", name).register(registry)}.increment()
Example 13. Initiate and increment counters in Kotlin
Visualizing Applications with Docker Compose
By setting up the previous parts we have configured and initiated counters and similar endpoints for each framework.
The following section explores how to run all endpoints and describes how to connect them with the Prometheus and Grafana instances in the “isolated” network.
For these purposes, we build individual docker images (Example 14 and GitHub project) and configure a Docker Compose file.
FROM eclipse-temurin:17-centos7
RUN mkdir /app
RUN mkdir /app/resources
COPY --from=build /app_build/quarkus-java-monitoring/build/quarkus-app /app
WORKDIR /app
CMD ["sh", "-c", "java -jar quarkus-run.jar"]
Example 14. Docker file approach, with quarkus example
Having docker images prepared now, we need to properly configure a linkage between each particular framework and the Prometheus and Grafana nodes.
The reason is that Grafana takes the provided data from the prometheus as a datasource.
To do so we need to add a link to the “prometheus.yml” file and configure all desired jobs (Example 15.).
global:
 scrape_interval: 5s
scrape_configs:
 - job_name: 'ktor-monitoring'
   metrics_path: /metrics
   static_configs:
     - targets: ['app-ktor:3800']
 - job_name: 'micronaut-monitoring'
   metrics_path: /metrics
   static_configs:
     - targets: [ 'app-micronaut:3802'
Example 15. Prometheus jobs configuration refers to the docker-compose file
As a careful reader may have noticed, the names of the targets are referring to the names and ports used inside the docker-file (Example 16.).
services:
 app-ktor:
   image: ktor-monitoring:latest
   restart: always
   ports:
     - "3800:3800"
Example 16. Docker-file example of particular node definition (Example 15.)
Now everything is configured and the connection between all considered frameworks, Prometheus and Grafana docker nodes is configured. It is possible to run and play with the data.
Playing with Grafana
All nodes are up and running (Example 17.)! Now let’s generate some traffic in order to be able to observe some actions. Luckily there is one commonly used tool that allows us to generate a continual traffic without much effort.
$ docker container ls --format '{{.Names}}'
fw-monitoring-examples_grafana_1
fw-monitoring-examples_prometheus_1
fw-monitoring-examples_app-spring-boot_1
fw-monitoring-examples_app-quarkus-java_1
fw-monitoring-examples_app-spring-boot-kt_1
fw-monitoring-examples_app-micronaut-kt_1
fw-monitoring-examples_app-micronaut_1
fw-monitoring-examples_app-ktor_1
fw-monitoring-examples_app-quarkus-kotlin_1
Example 17. Considered containers are up
Let’s use POSTMAN and create an appropriate collection. Such a collection should address all exposed endpoints and be executed repeatedly against them. Not implemented path causes the HTTP 404 responses (not found) (Img 2.) the rest should pass with HTTP response 200 (ok).
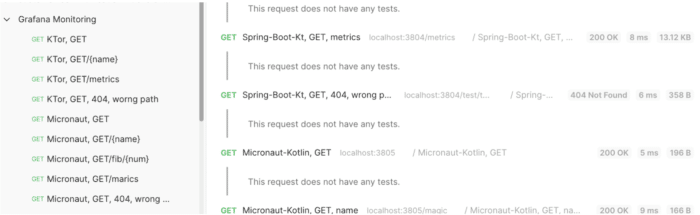
Image 2. Execution of POSTMAN collection
Congratulations! The POSTMAN collection is running and data points are being generated and emitted through Prometheus to the example Grafana dashboard we have created to observe availability and behavior of considered nodes. We can now nicely observe JVM behavior by utilizing a functionality provided by the Prometheus(Img 3).
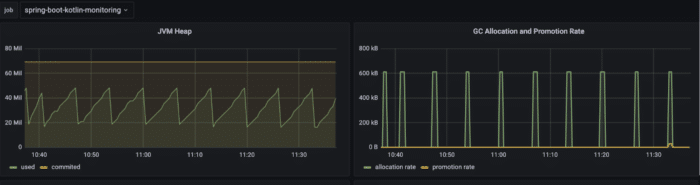
Image 3. Observing the heap and GC behavior for the “spring-boot-kotlin” job
Grafana provides very helpful functionality to aggregate for example all GET requests across the all considered docker nodes and display them at the “real-time” manner.
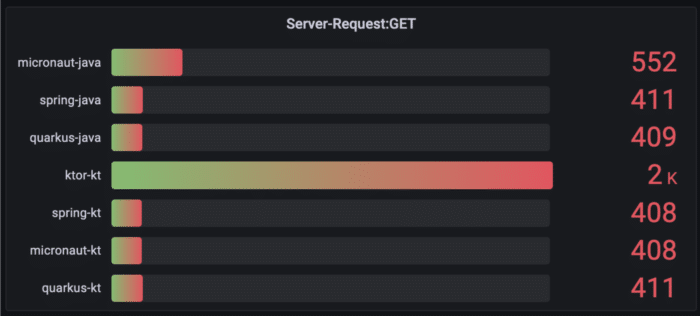
Image 4. Capturing all get request coming to the docker nodes
As has been already mentioned, Grafana provides a very neat environment to work with results of implemented counters. It’s possible to display a timeline of requested names and put them into the context of application endpoints observability (Img 5.)
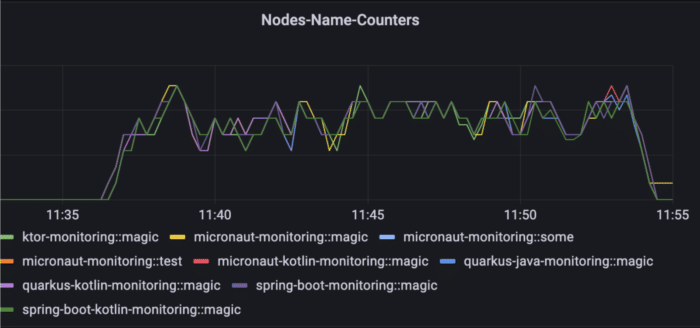
Image 5. Timeline of requested name endpoints and the customer “Counter” provided by each docker node
Conclusion
In this article we have discovered how to expose metrics that provide JVM specific information, which may be helpful and relevant for gaining a closer understanding of the implemented code.
Technologies Used
- Docker 20.10
- OpenJDK 17
- Gradle 7.4
- KTor 1.6.7 with Koin 3.1.5
- Micronaut Java,Kotlin 3.3.4
- Quarkus Java, Kotlin 2.7.3
- Spring-Boot Java, Kotlin 2.6.4
- Grafana 8.5.0
- Prometheus 2.33.3
- Micrometer 1.8.3
We have shown how to attach the application to a Prometheus instance and how to expose data to the Grafana API in order to create informative dashboards.
We have also shown the importance of observability in the Cloud age as it may play a key role in reducing costs.
Happy observing and enjoy the GitHub project.
- March 30, 2022
- 9 min read
Christian has more than 12 years of project experience in the Java Ecosystem. In the past 10 years, he worked with well-known companies such as Deutsche Telekom and BSH. He focuses on the design and implementation of highly scalable and durable software architectures, as well as on how to smoothly migrate legacy systems. Christian’s roles so far have been Senior Software Engineer, Software Architect, as well as Team Leader, and last but not least, CTO of his IoT start-up. In the last 7 years Christian also looked into other JVM languages such as Groovy and especially Kotlin, which he very much enjoys and successfully worked with in his last projects.
Miro is a Java Champion and Oracle ACE Pro with a career-long focus on enterprise AI, including machine learning, neural networks, and probabilistic algorithms. As a contributor to OpenJDK and Mission Control, he specializes in optimizing Java performance, system maintainability and AI utilization in the enterprise. Beyond his engineering work, Miro co-authored the Duke’s Choice Award-winning Robo4j project and contributes to various open-source initiatives like OpenTracing and Pi4J. A recognized JavaOne Rock Star, he actively shapes the industry through the JCP, his technical blog, and frequent speaking engagements at global conferences such as JavaOne, CodeOne, Devoxx, JCON, JavaLand etc.


Comments (1)
Camper Remodel Near Me
4 years agoI used to be able to find good advice from your blog articles.