


Spring Boot 4 OpenTelemetry Guide: Metrics, Traces, and Logs Explained
- December 10, 2025
- 6 min read
In my previous article, I outlined a comprehensive list of features introduced in Spring Framework 7 and Spring Boot 4.
In this series of articles, we will explore these features in detail using a pragmatic approach. In this second article, I will dive deep into integration of Observability framework i.e., OpenTelemetry with SpringBoot.
As an architect and developer, when I engage in system design—whether it involves monolithic architecture, microservices, or contemporary cloud-native applications—I have made the integration of observability patterns utilizing open-telemetry tools a standard practice. Through observability, we can monitor application behavior via metrics, logs, and traces that we trigger
Before the release of Spring Boot 4, developers needed to incorporate numerous dependencies related to open telemetry, including various micrometer dependencies, which could be quite overwhelming at times. However, with the introduction of Spring Boot 4, the team streamlined this process by adding a single starter dependency, namely spring-boot-starter-opentelemetry, which automatically includes most of the micrometer dependencies. The OTLP protocol serves as the key enabler here, rather than any specific library.
Before we deep dive into OpenTelemetry with Spring Boot 4, let us first grasp some fundamental concepts and understand what each of them signifies.
Key Terminology
- Metrics act as numerical representations of aggregated data that various input sources, including hardware, software, and applications, provide. This includes monitoring resource utilization, performance, and user behavior. Teams can utilize various types of metrics, specifically application metrics, system metrics, and business metrics. Mainly talks about what happens inside the system
- Logs provide granular information regarding the specifics of the events, offering deeper insights into the reasons behind issues that occur at specific timestamps. Mainly talks about why issues occur
- Traces show us the events that occur during a complete transaction of a request or session, allowing us to pinpoint where and what transpired within a user session. By utilizing traces, we can identify which metrics or logs we associate with a specific issue, thereby helping us mitigate future problems such as API request slowness, API traffic, service-to-service interactions, workload, and internal API calls. Mainly talks about where the issue is occurring.
- Observability is evaluating the current state of an application and involves integrating logs, metrics, and traces data.
- Telemetry involves collecting all the unprocessed data that contributes to monitoring and enables more in-depth analysis, yielding thorough insights.
- The OpenTelemetry documentation states that OpenTelemetry is an open-source framework for observability that facilitates users in generating, exporting, and collecting telemetry data such as logs, metrics, and traces.
- Spring Boot Actuator, a subproject of Spring Boot, facilitates the management and monitoring of our application through HTTP endpoints or JMX. It reveals multiple endpoints that provide extensive information about the application across various instrumentation details.
After we understand the key terminology, let’s explore how and what changed in the integration of open telemetry with Spring Boot 4.
Why OpenTelemetry?
In contemporary cloud-native applications, we will develop a sophisticated microservice architecture that integrates intricate business requirements. We find the necessity for both application and infrastructure observability to be crucial.
The OpenTelemetry framework guides us with two fundamental principles:
- You own the data that you create, ensuring there is no vendor lock-in.
- You need to familiarize yourself with only one set of APIs and conventions.
Before the release of Spring Boot 4, we faced several challenges in integrating open telemetry, specifically:
- OpenTelemetry Java Agent—Zero code changes but has version compatibility issues.
- 3rd-party OpenTelemetry Spring Boot Starter - External dependency
With Spring Boot 4, developers provide open telemetry with either native or in-house support as a starter dependency. This spring-boot-starter-opentelemetry is the recommended approach, as it
- Supports GraalVM native-image and AOT compilation
- Integrates natively with Micrometer
- Exports signals via OTLP protocol
- Works seamlessly with Spring Boot 4.0
Step-by-Step Guide
If you already have an existing Spring Boot application, you can begin by incorporating the following dependency; otherwise, you can start creating a Spring Boot application using Spring Initializr.
Step 1: Add the opentelemetry dependency in the pom.xml
<dependency>
    <groupId>org.springframework.boot</groupId>
    <artifactId>spring-boot-starter-opentelemetry</artifactId>
</dependency>
Or in the build.gradle
implementation 'org.springframework.boot:spring-boot-starter-opentelemetry'
Note: This starter includes
- OpenTelemetry API
io.micrometer:micrometer-registry-otlpfor metricsio.micrometer:micrometer-tracing-bridge-otelfor traces
In Spring Boot 3, you must add the dependencies mentioned above individually to implement OpenTelemetry.
Step 2: Configure Logs Export
- Add the OpenTelemetry Logback appender to
pom.xml
<dependency>
    <groupId>io.opentelemetry.instrumentation</groupId>
    <artifactId>opentelemetry-logback-appender-1.0</artifactId>
    <version>2.21.0-alpha</version> // version might change later
</dependency>
Or in build.gradle:
implementation 'io.opentelemetry.instrumentation:opentelemetry-logback-appender-1.0:2.21.0-alpha'
2. Enable Log Export Property by adding the below property in application.properties
management.opentelemetry.logging.export.otlp.endpoint=http://localhost:4318/v1/logs
Or in YAML:
management:
  opentelemetry:
    logging:
      export:
        otlp:
          endpoint: http://localhost:4318/v1/logs
3. Configure Logback Appender
Create src/main/resources/logback-spring.xml:
<?xml version="1.0" encoding="UTF-8"?>
<configuration>
    <include resource="org/springframework/boot/logging/logback/base.xml"/>

    <appender name="OTEL" class="io.opentelemetry.instrumentation.logback.appender.v1_0.OpenTelemetryAppender">
    </appender>

    <root level="INFO">
        <appender-ref ref="OTEL"/>
    </root>
</configuration>
4. Install OpenTelemetry Appender
Create a component to initialize the appender:
import io.opentelemetry.api.OpenTelemetry;
import io.opentelemetry.instrumentation.logback.appender.v1_0.OpenTelemetryAppender;
import org.springframework.beans.factory.InitializingBean;
import org.springframework.stereotype.Component;

@Component
public class InstallOpenTelemetryAppender implements InitializingBean {

    private final OpenTelemetry openTelemetry;

    public InstallOpenTelemetryAppender(OpenTelemetry openTelemetry) {
        this.openTelemetry = openTelemetry;
    }

    @Override
    public void afterPropertiesSet() throws Exception {
        OpenTelemetryAppender.install(openTelemetry);
    }
}
Step 3: Configure Metrics Export
- Enable Metrics Export
Add the following property to application.properties:
# For development keep 1.0 for all traces to export, production environment keep 0.1
management.tracing.sampling.probability=1.0
management.otlp.metrics.export.url=http://localhost:4318/v1/metrics
Or in application.yml:
management:
  otlp:
    metrics:
      export:
        url: http://localhost:4318/v1/metrics
2. Configure OpenTelemetry Semantic Conventions
You can select the metrics for export and configure them as beans, such as Process Metrics, JVM Memory Metrics, and JVM Thread Metrics.
Create a configuration class to use OpenTelemetry semantic conventions:
import io.micrometer.core.instrument.Tags;
import io.micrometer.core.instrument.binder.jvm.ClassLoaderMetrics;
import io.micrometer.core.instrument.binder.jvm.JvmMemoryMetrics;
import io.micrometer.core.instrument.binder.jvm.JvmThreadMetrics;
import io.micrometer.core.instrument.binder.jvm.convention.otel.OpenTelemetryJvmClassLoadingMeterConventions;
import io.micrometer.core.instrument.binder.jvm.convention.otel.OpenTelemetryJvmCpuMeterConventions;
import io.micrometer.core.instrument.binder.jvm.convention.otel.OpenTelemetryJvmMemoryMeterConventions;
import io.micrometer.core.instrument.binder.jvm.convention.otel.OpenTelemetryJvmThreadMeterConventions;
import io.micrometer.core.instrument.binder.system.ProcessorMetrics;

@Configuration(proxyBeanMethods = false)
public class OpenTelemetryConfiguration {

    @Bean
    OpenTelemetryServerRequestObservationConvention openTelemetryServerRequestObservationConvention() {
        return new OpenTelemetryServerRequestObservationConvention();
    }

    @Bean
    OpenTelemetryJvmCpuMeterConventions openTelemetryJvmCpuMeterConventions() {
        return new OpenTelemetryJvmCpuMeterConventions(Tags.empty());
    }

    @Bean
    ProcessorMetrics processorMetrics() {
        return new ProcessorMetrics(
            List.of(),
            new OpenTelemetryJvmCpuMeterConventions(Tags.empty())
        );
    }

    @Bean
    JvmMemoryMetrics jvmMemoryMetrics() {
        return new JvmMemoryMetrics(
            List.of(),
            new OpenTelemetryJvmMemoryMeterConventions(Tags.empty())
        );
    }

    @Bean
    JvmThreadMetrics jvmThreadMetrics() {
        return new JvmThreadMetrics(
            List.of(),
            new OpenTelemetryJvmThreadMeterConventions(Tags.empty())
        );
    }

    @Bean
    ClassLoaderMetrics classLoaderMetrics() {
        return new ClassLoaderMetrics(
            new OpenTelemetryJvmClassLoadingMeterConventions()
        );
    }
}
Step 4: Configure Traces Export
- Add the following property to enable trace export in
application.properies
management.opentelemetry.tracing.export.otlp.endpoint=http://localhost:4318/v1/traces
Or in application.yml
management:
  opentelemetry:
    tracing:
      export:
        otlp:
          endpoint: http://localhost:4318/v1/traces
Spring Boot automatically configures:
OtlpHttpSpanExporter(orOtlpGrpcSpanExporterfor gRPC)- OpenTelemetry SDK for trace export
- Micrometer Observation API to OpenTelemetry bridge
In the configuration mentioned above, management.otlp.metrics.export.url specifies the destination for metrics in Spring Boot which uses Micrometer's OTLP exporter (hence management.otlp.metrics). A collector that is compatible with OTLP directs the data. management.opentelemetry.tracing.export.otlp.endpoint indicates where Spring Boot should send traces and use the OpenTelemetry tracing bridge (hence management.opentelemetry.tracing).
Both send data to the same collector (port 4318), but the configuration paths differ because of the way the libraries integrate.
Step 5: Add Trace ID to HTTP Response Headers
Create a Servlet filter to include trace ID in response headers:
import io.micrometer.tracing.Tracer;
import jakarta.servlet.FilterChain;
import jakarta.servlet.ServletException;
import jakarta.servlet.http.HttpServletRequest;
import jakarta.servlet.http.HttpServletResponse;
import org.jspecify.annotations.Nullable;
import org.springframework.stereotype.Component;
import org.springframework.web.filter.OncePerRequestFilter;

import java.io.IOException;
@Component
public class TraceIdFilter implements Filter {

    @Override
    public void doFilter(ServletRequest request, ServletResponse response, FilterChain chain)
            throws IOException, ServletException {

        if (response instanceof HttpServletResponse httpResponse) {
            String traceId = Span.current().getSpanContext().getTraceId();
            httpResponse.setHeader("X-Trace-Id", traceId);
        }

        chain.doFilter(request, response);
    }
}
This allows users to include the trace ID when reporting errors.
Testing with Docker Compose
- Set Up Local OTLP Backend
Create compose.yaml in your project root:
services:
  otel-lgtm:
    image: grafana/otel-lgtm
    ports:
      - "3000:3000"   # Grafana UI
      - "4318:4318"   # OTLP HTTP receiver
      - "4317:4317"   # OTLP gRPC receiver
    environment:
      - GF_SECURITY_ADMIN_PASSWORD=admin
2. Add Docker Compose Support (Optional)
Add dependency for automatic Docker Compose integration:
<dependency>
    <groupId>org.springframework.boot</groupId>
    <artifactId>spring-boot-docker-compose</artifactId>
    <scope>runtime</scope>
    <optional>true</optional>
</dependency>
Spring Boot will automatically:
- Detect
compose.yaml - Run
docker compose up - Configure OTLP endpoints automatically
3. Run and Verify
- Start your application
- Access Grafana at
http://localhost:3000(username: admin, password: admin) - Make requests to your application
- View:
- Logs: All application logs with trace IDs
- Traces: Distributed traces with span details
- Metrics: JVM metrics, custom metrics, HTTP metrics
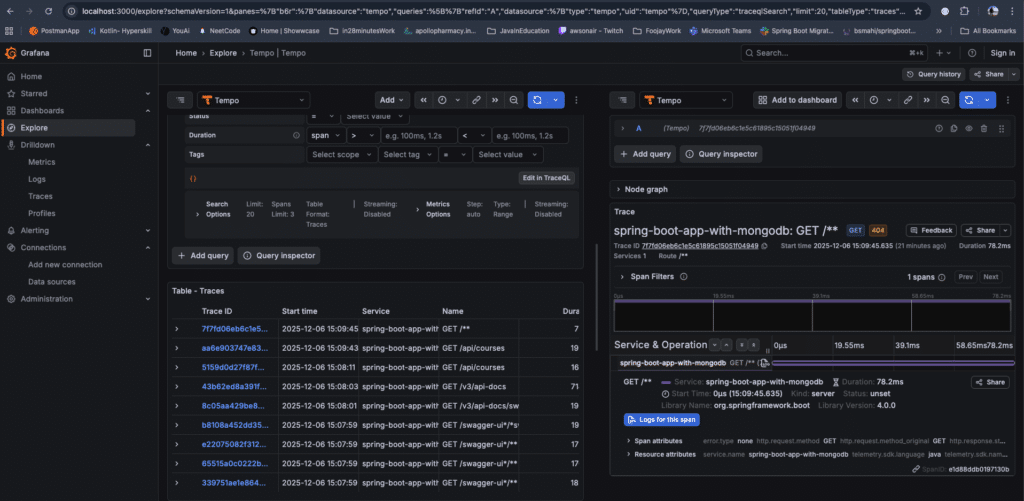
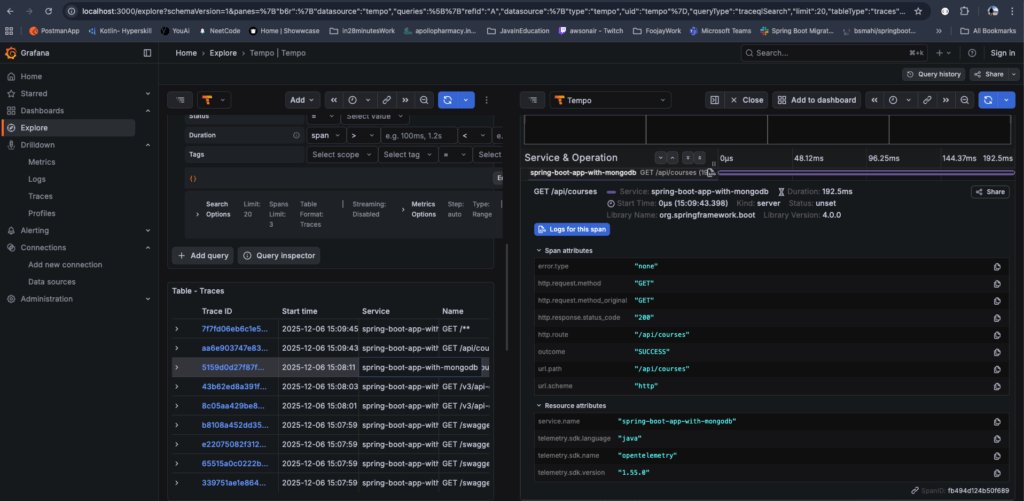
- Navigate Home > Explore > Tempo
- Click Search and select service "spring-boot-app-with-mongodb"
- Click on a Trace to see the span details
The complete code can be found over on Github.
Conclusion
Developers must incorporate observability into modern cloud-native applications, as it has become essential and significantly aids in effectively monitoring the application. With spring-boot-starter-opentelemetry dependency, spring boot it automcatically perform an instrumentation for:
- The HTTP server handles requests for all controller endpoints.
- The HTTP client makes requests using RestTemplate(deprecated), RestClient, and WebClient.
- The JDBC database executes calls.
- Logs contain Trace/span IDs.
References
- OpenTelemetry: https://opentelemetry.io/docs/what-is-opentelemetry/
- Observability https://www.elastic.co/blog/observability-metrics
- Spring Blog https://spring.io/blog/2025/11/18/opentelemetry-with-spring-boot
Happy Learning!
- December 10, 2025
- 6 min read
I am a Senior Technical Architect from India with over 18 years of experience in Java, Spring, microservices, and AWS. I am passionate about crafting scalable solutions and contributing to open-source projects such as Spring, Arconia, and OpenRewrite.


Comments (0)
No comments yet. Be the first.