

SQL Query Optimization: How to Identify and Optimize Slow SQL Queries
- May 09, 2024
- 7 min read
In this article, we want to share our experience with fellow developers and offer insights using real-life examples on how to identify and optimize slow SQL queries, especially when working with relational database management systems like PostgreSQL, MySQL, MSSQL, Oracle, etc.
If you are a developer who doesn’t use database ORMs like Hibernate that much, you are no stranger to the concept of SQL query optimization. As developers, we know that a slow SQL query can reduce our application’s efficiency and performance, leaving our users with a bad experience.
That’s why we decided to share our experience and offer insights using real-life examples on how to identify and optimize SQL queries.
The context
Here’s our story—while monitoring our Postgres database in the development environment, we noticed a significant increase in CPU usage and set out to identify which queries were causing the issue.
Why is it hard to find slow SQL queries?
- High volume of queries: When you have a high volume of queries against the database your application is talking to, it can be challenging to find slow SQL queries.
- Missing database indexes: When a database has tables with missing indexes, it can lead to slow SQL queries, particularly when the columns that come after the WHERE, JOIN, GROUP BY, and ORDER BY clauses are not indexed.
- Complexity: SQL queries that run against a single table or a small amount of data will get executed much faster than SQL queries with many joins, subqueries, and aggregations.
- Lack of Monitoring Tools: Monitoring tools like Digma, pghero, Grafana, Prometheus, etc, play a big role in finding slow SQL queries, and when a developer does not have these tools for whatever reason, it can really get hard to manually find slow SQL queries.
- Leaky Abstraction from ORM Frameworks: ORM Frameworks like Hibernate can indeed speed up development, help you not to write repetitive code, improve your application security, and reduce the need to master and write raw SQL queries.
All of these benefits are not without a major drawback: The infamous N + 1 query problem, this problem revolves around how ORM frameworks handle the lazy loading of related entries.
Solving SQL query issues before they become big problems using Continuous Feedback
Continuous Feedback is a new development practice that lets you access information about how your code and queries are performing much earlier in the development process. Continuous Feedback platforms automate the task of finding problematic queries in the traces and logs and providing the data to prioritize and solve them.
Fortunately, OTEL makes it extremely easy to get that data out without making any code changes. This can be done in dev/staging and even production environments. CF Tools are what we use to process that data, in order to make developers aware of how the code (or queries it runs) works in the real world.
In our case, we’ve been using our own CF tool, the Digma Continuous Feedback plugin during the development process, which saved us the need to look for problematic queries – Digma found them for us!
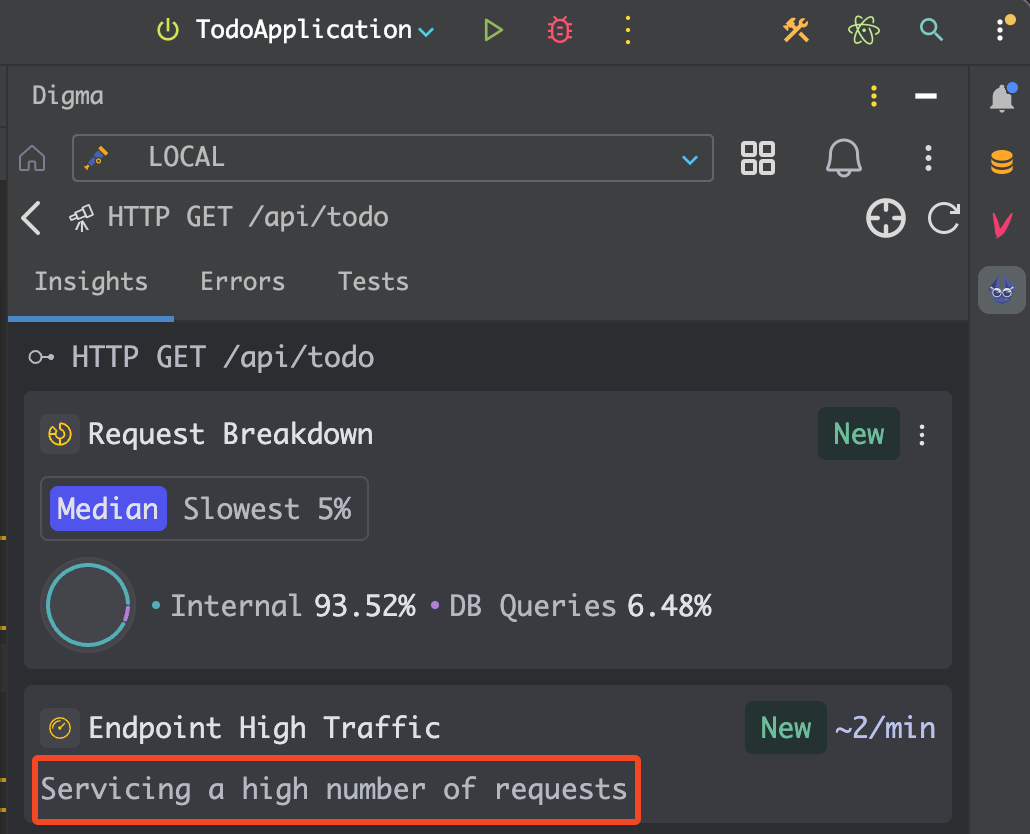
To make it more in-context with the work rather than a dashboard or external tool you need to consult, Digma’s runtime analysis is embedded right into the IDE:
To follow along and try for yourself – just install the Digma IDE plugin from the marketplace and run your code as you usually do.

What Digma had to say about our SQL queries
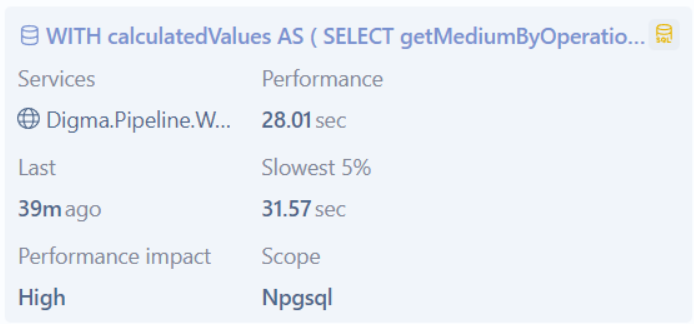
Upon inspecting our code with Digma, I discovered that one particular new query I added a few days ago took about 28 seconds to execute in staging, which of course significantly slower than anything else.
Continuous Feedback doesn’t acquire any new data – it just listens to the observability data stream to detect anything I should notice, this was definitely something you want to catch early on. The most important thing for me as a developer is finding out a not-optimized query before it goes to production.
Why SQL queries in databases can be slow
Wrong Index or No Index on Table to be queried
If we query the table below using the name, i.e.
SELECT name FROM task.todo WHERE name = “Install Digma”
If the name column is not indexed, what will happen is that the query will have to go through the table task.todo row by row, looking for the data that matches the specified name, which in our case is “Install Digma”. You are not likely to see any significant impact on the performance of your application until your table starts growing into having thousands and millions of records.
Fortunately for me, I don’t have to wait for my application to go live to notice that it is becoming less performant as users start using it. By using Digma, I can easily spot this potential issue ou.

So, how do I solve this issue? It is simple: create an index on the name column.CREATE INDEX task_names ON task.todo (name)
I can even go ahead to future-proof my database performance and create multiple or composite indexes on the same table.
CREATE INDEX task_name_date_status ON task.todo (name, start_time, end_time, task_status)
Running Queries with asterisks
SELECT * FROM task.todo
Running this kind of query will get you into trouble when the database your application relies on starts growing. You’ll get greeted with java.lang.outOfMemoryError if the SQL query eventually gets executed after taking some time.
Here is the right thing to do:
SELECT name, start_time, end_time, task_status FROM task.todo WHERE name = “Install Digma”
Writing our SQL query like this helps us make our SELECT statement compact and forces us to fetch only the data we need from the database.
Growing Client Base
When your database starts growing due to many users signing up to use your application, you’ll discover that complexity (a function describing the number of operations needed to get a result) comes in.
We can not talk about a growing client base without talking about time complexity, which measures how long a query will take to run as the data tables in a database increase. A table with 100k users could require up to 100k operations to check for a username.
Resolving the query issue
After a brief investigation, I realized that adding the right index to the relevant table could improve the query performance.
Consequently, after adding the index, the query’s execution time decreased from 28 seconds to 32 milliseconds, which I could also validate easily amazingly!
After a brief investigation, I realized that adding the right index to the relevant table could improve the query performance.
Consequently, after adding the index, the query’s execution time decreased from 28 seconds to 32 milliseconds, which I could also validate easily amazingly!

Finding other opportunities for SQL query optimization
As we continue to work on our code, Digma will analyze the data in the backend and continue to look for opportunities for improvement. One example is searching for SQL queries that are significantly slower than other queries of the same type, running on the same DB, which makes them great candidates for optimization.
This data can be readily accessed during development or code reviews along with other types of suggested improvements and detected issues such as an unusually high number of queries, N+1 selects, the “open session in view” antipattern, and other insights.


Where to spend your efforts?
Being aware of problematic queries is important to ship better code. However, this can easily lead developers down the rabbit hole of micro-optimization. Blindly following the trail of inefficiencies might lead to more elegant queries but won’t necessarily have any impact on your users.
Consider, for example, a slow query that is used only rarely. Will that be a good candidate for optimization if it only affects a small fraction of the requests? How about a slow query in a background job that only takes up a marginal amount of the overall process?
To help solve these problems, Digma provides performance impact scoring for each query. In this manner, we can look at our optimization candidates not just from a problem severity perspective but also looking at how they are used and how they are impacting flows within the system.
In the screen above we can see how sorting by performance impact actually allowed me to find the best candidates to focus my efforts on and that eventually also yielded the most effect on our application.

How to Optimize SQL Queries
There are so many methods with which a developer can optimize SQL queries; the methods I’m about to share have been very useful in my career as a software engineer.
- Different RDBMS have optimizations that are specific to them; familiarizing yourself with the features and optimizations peculiar to your chosen database system (e.g., MySQL, PostgreSQL, SQL Server) will form the foundation of your SQL optimization process.
- Use parameterized queries; it will remove the need for your database system to recompile and optimize query plans.
- Configure your database for optimal performance by adjusting disk usage, memory allocation, and network configuration.
- Look out for unwanted indexes, as this will affect the performance of your application when you run SQL queries that use the INSERT or UPDATE command.
- Check if the table the SQL query is running against to see if it is large and decide if the table should be partitioned in a way that the query optimizer of your database system can reduce the number of rows that need to be examined.
- Be sure to properly index the columns that come after the WHERE, JOIN, and ORDER BY clauses.
- For frequently used queries, put them in stored procedures, as it will save you time due to the precompiled execution plan that comes with it.
Conclusion: How to optimize slow SQL queries
Identifying slow SQL queries and then optimizing them can be tedious and time-consuming, but with a sound knowledge of SQL, knowing how to take advantage of continuous feedback, and using database monitoring tools, you can quickly find a slow SQL query and optimize it.
However, even more tricky than optimizing SQL queries is finding out about these issues, and navigating the many problems to solve those that matter. By using Continuous Feedback tools we can create a dev process in which spotting and assessing such problems doesn’t require any reactive effort but is proactively a part of how our code gets deployed and an organic part of our work environment.
Learn more: Here
Revenue Intelligence for Dev-Focused Companies
Reo.Dev analyzes developer activity across 20+ sources to identify high-intent accounts and key contacts ready to buy.
See How Reo.Dev Works!
- May 09, 2024
- 7 min read
Senior Software Engineer at Digma


Comments (1)
Java Weekly, Issue 542 | Baeldung
2 years ago[…] >> SQL Query Optimization: How to Identify and Optimize Slow SQL Queries [foojay.io] […]