Stateless, Secretless Multi-cluster Monitoring in Azure Kubernetes Service with Thanos, Prometheus and Azure Managed Grafana
- July 27, 2022
- 6 min read
Introduction
Observability is paramount to every distributed system and it's becoming increasingly complicated in a cloud native world where we might deploy multiple ephemeral clusters and we want to keep their metrics beyond their lifecycle span.
This article aims at cloud native engineers that face the challenge of observing multiple Azure Kubernetes Clusters (AKS) and need a flexible, stateless solution, leveraging available and cost-effective blob storage for long term retention of metrics, one which does not require injecting static secrets to access the storage (as it leverage the native Azure Managed Identities associated with the cluster).
This solution builds upon well-established Cloud Native Computing Foundation (CNCF) open source projects like Thanos and Prometheus,together with a new managed services, Azure Managed Grafana, recently released in public preview. It allows for ephemeral clusters to still have updated metrics without the 2-hours local storage of metrics in the classic deployment of Thanos sidecar to Prometheus.
This article was inspired by several sources, most importantly this two articles: Using Azure Kubernetes Service with Grafana and Prometheus and Store Prometheus Metrics with Thanos, Azure Storage and Azure Kubernetes Service on Microsoft Techcommunity blog.
Prerequisites
- An 1.23 or 1.24 AKS cluster with either a user-managed identity assigned to the kubelet identity or system-assigned identity
- Ability to assign roles on Azure resources (User Access Administrator role)
- A storage account
- (Recommended) A public DNS zone in Azure
- Azure CLI
- Helm CLI
Architecture
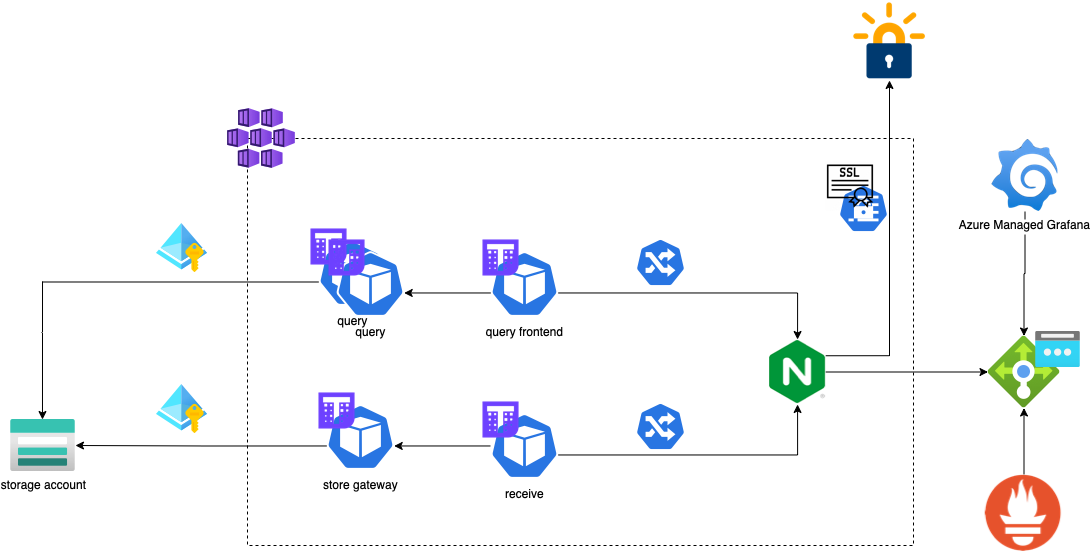
We will deploy all components of Thanos and Prometheus in a single cluster, but since they are couple only via the ingress they don't need to be co-located.

Cluster-wide services
For Thanos receive and query components to be available outside the cluster and secured with TLS, we will need ingress-nginx and cert-manager. For ingress, deploy the Helm chart using the following command, to account for this issue with AKS clusters >1.23:
helm upgrade --install ingress-nginx ingress-nginx \
  --repo https://kubernetes.github.io/ingress-nginx \
  --set controller.service.annotations."service\.beta\.kubernetes\.io/azure-load-balancer-health-probe-request-path"=/healthz \
  --set controller.service.externalTrafficPolicy=Local \
  --namespace ingress-nginx --create-namespace
Notice the extra annotations and the externalTrafficPolicy set to Local.
Next, we need cert-manager to automatically provision SSL certificates from Let's Encrypt; we will just need a valid email address for the ClusterIssuer:
helm upgrade -i cert-manager \
  --namespace cert-manager --create-namespace \
  --set installCRDs=true \
  --set ingressShim.defaultIssuerName=letsencrypt-prod \
  --set ingressShim.defaultIssuerKind=ClusterIssuer \
  --repo https://charts.jetstack.io cert-manager

kubectl apply -f - <<EOF
apiVersion: cert-manager.io/v1
kind: ClusterIssuer
metadata:
  name: letsencrypt-prod
spec:
  acme:
    email: [email protected]
    server: https://acme-v02.api.letsencrypt.org/directory
    privateKeySecretRef:
      name: letsencrypt-prod
    solvers:
    - http01:
        ingress:
          class: nginx
EOF
Last but not least, we will add a DNS record for our ingress Loadbalancer IP, so it will be seamless to get public FQDNs for our endpoints for Thanos receive and Thanos Query.
az network dns record-set a add-record  -n "*.thanos" -g dns -z cookingwithazure.com \
--ipv4-address $(kubectl get svc ingress-nginx-controller -n ingress-nginx -o jsonpath="{.status.loadBalancer.ingress[0].ip}")
Note how we use kubectl with jsonpath type output to get the ingress public IP. We can now leverage the wildcard FQDN *.thanos.cookingwithazure.com in our ingresses and cert-manager will be able to obtain the relative certificate seamlessly.
Storage account preparation
Because we do not want to store any secret or service principal in-cluster, we will leverage the Managed Identities assigned to the cluster and assign the relevant Azure Roles to the storage account.
Once you have created or identified the storage account to use and created a container within it, to store the Thanos metrics, assign the roles using the azure cli; first, determine the clientID of the managed identity:
clientid=$(az aks show -g <rg> -n <cluster_name> -o json --query identityProfile.kubeletidentity.clientId)
Now, assign the role of Reader and Data Access to the Storage account (you need this so the cloud controller can generate access keys for the containers) and the Storage Blob Data Contributor role to the container only (there's no need to give this permission at the storage account level, because it will enable writing to every container, which we don't need. Always remember to apply the principles of least privileges!)
az role assignment create --role "Reader and data access" --assignee $clientid --scope /subscriptions/<subID>/resourceGroups/<rg>/providers/Microsoft.Storage/storageAccounts/<account_name>

az role assignment create --role "Storage Blob Data Contributor" --assignee $clientid --scope /subscriptions/<subID>/resourceGroups/<rg>/providers/Microsoft.Storage/storageAccounts/<account_name>/containers/<container_name>
Create basic auth credentials
Ok, we kinda cheated in the title: you do need one credential at least for this setup, and it's the one to access the Prometheus API exposed by Thanos from Azure Managed Grafana.
We will use the same credentials (but feel free to generate a different one) to push metrics from Prometheus to Thanos using remote-write via the ingress controller. You'll need a strong password stored into a file called pass locally:
htpasswd -c  -i auth thanos < pass

#Create the namespaces
kubectl create ns thanos
kubectl create ns prometheus

#for Thanos Query and Receive
kubectl create secret generic -n thanos basic-auth --from-file=auth

#for Prometheus remote write
kubectl create secret generic -n prometheus remotewrite-secret \
--from-literal=user=thanos \
--from-literal=password=$(cat pass)
We now have the secrets in place for the ingresses and for deploying Prometheus.
Deploying Thanos
We will use the Bitnami chart to deploy the Thanos components we need.
helm upgrade -i thanos -n monitoring --create-namespace --values thanos-values.yaml bitnami/thanos
Let's go thru the relevant sections of the values file:
objstoreConfig: |-
  type: AZURE
  config:
    storage_account: "thanostore"
    container: "thanostore"
    endpoint: "blob.core.windows.net"
    max_retries: 0
    user_assigned_id: "5c424851-e907-4cb0-acb5-3ea42fc56082"
(replace the user_assigned_id with the object id of your kubeletIdentity, for more information about AKS identities, check out this article) This section instructs the Thanos Store Gateway and Compactor to use an Azure Blob store, and to use the kubelet identity to access it. Next, we enable the ruler and the query components:
ruler:
  enabled: true

query:
  enabled: true
...
queryFrontend:
  enabled: true
We also enable autoscaling for the stateless query components (the query and the query-frontend; the latter helps aggregating read queries), and we enable simple authentication for the Query frontend service using ingress-nginx annotations:
queryFrontend:
...
  ingress:
    enabled: true
    annotations:
      cert-manager.io/cluster-issuer: letsencrypt-prod
      nginx.ingress.kubernetes.io/auth-type: basic
      nginx.ingress.kubernetes.io/auth-secret: basic-auth
      nginx.ingress.kubernetes.io/auth-realm: 'Authentication Required - thanos'
    hostname: query.thanos.cookingwithazure.com
    ingressClassName: nginx
    tls: true
The annotation references the basic-auth secret we created before from the htpasswd credentials.
Note that the same annotations are also under the receive section, as we're using the exact same secret for pushing metrics into Thanos (although with a different hostname).
Prometheus remote-write
Until full support for Agent mode lands in the Prometheus operator (follow this issue), we can use the remote write feature to ship every metrics instantly to a remote endpoint, in our case represented by the Thanos Query Frontend ingress. Let's start by deploying Prometheus using the kube-prometheus-stack helm chart:
helm upgrade -i -n prometheus promremotewrite -f prom-remotewrite.yaml prometheus-community/kube-prometheus-stack
Let's go thru the values file to explain the options we need to enable remote-write:
prometheus:
  enabled: true
  prometheusSpec:
    externalLabels:
      datacenter: westeu
      cluster: playground
This enables Prometheus and attaches two extra labels to every metrics, so it becomes easier to filter data coming from multiple sources/clusters later in Grafana.
remoteWrite:
- url: "https://receive.thanos.cookingwithazure.com/api/v1/receive"
  name: Thanos
  basicAuth:
    username:
      name: remotewrite-secret
      key: user
    password:
      name: remotewrite-secret
      key: password
This section points to the remote endpoint (secured via SSL using Let's Encrypt certificates, thus trusted by the certificate store on the AKS nodes; if you use a non-trusted certificate, refer to the TLSConfig section of the PrometheusSpec API). Note how the credentials to access the remote endpoint are coming from the secret created beforehand and stored in the prometheus namespace.
Note here that although Prometheus is deployed in the same cluster as Thanos for simplicity, it sends the metrics to the ingress FQDN, thus it's trivial to extend this setup to multiple, remote clusters and collect their metrics into a single, centralized Thanos receive collector (and a single blob storage), with all metrics correctly tagged and identifiable.
Observing the stack with Azure Managed Grafana
Azure Managed Grafana (AME) is a new offering in the toolset of observability tools in Azure, and it's based on the popular open source dashboarding system Grafana.
Beside out of the box integration with Azure, AME is a fully functional Grafana deployment that can be used to monitor and graph different sources, including Thanos and Prometheus.
To start, head to the Azure Portal and deploy AME; then, get the endpoint from the Overview tab and connect to your AME instance.
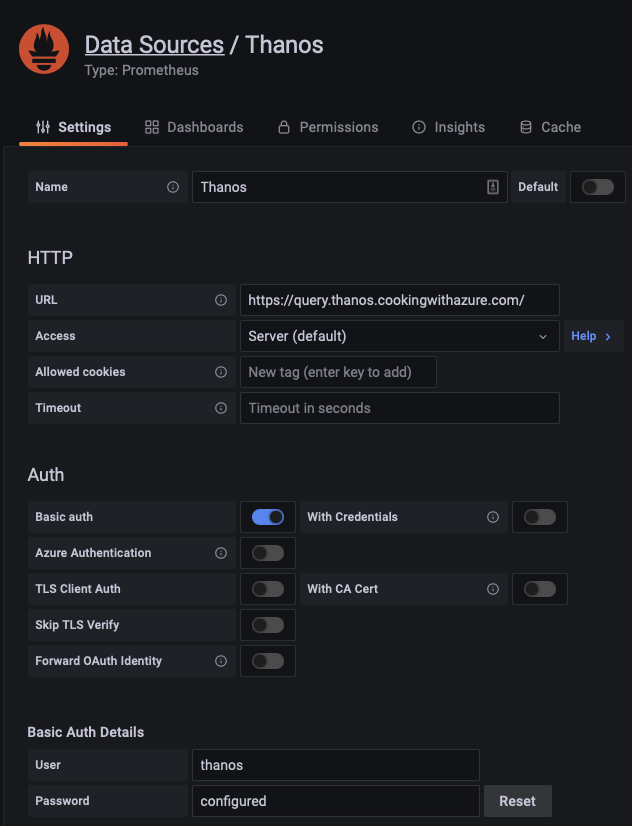
Add a new source of type Prometheus and basic authentication (the same we created before):

Congratulations! We can now visualize the data flowing from Prometheus, we only need a dashboard to properly display the data.
Go to (on the left side navigation bar) Dashboards-> Browse and click on Import; import the "Kubernetes / Views / Global" (ID: 15757) into your Grafana and you'll be able to see the metrics from the cluster:

The imported dashboard has no filter for cluster or region, thus will show all cluster metrics aggregated. We will show in a future post how to add a variable to a Grafana dashboard to properly select and filter cluster views.
Future work
This setup allows for autoscaling of receiver and query frontend as horizontal pod autoscalers are deployed and associated with the Thanos components.
For even greater scalability and metrics isolation, Thanos can be deployed multiple times (each associated with different storage accounts as needed) each with a different ingress to separate at the source the metrics (thus appearing as separate sources in Grafana, which can then be displayed in the same dashboard, selecting the appropriate source for each graph and query).
- July 27, 2022
- 6 min read


Comments (0)
No comments yet. Be the first.