Debugging Tutorial: Java Return Value, IntelliJ Jump to Line and more
- March 02, 2022
- 4 min read
I just published the 3rd episode of the "140 Second Duckling" tutorial series and I'm getting into the rhythm of doing them. I posted the 2nd episode last week and in this post I'll dig deeper into both.
I tackled a lot of basic stuff about debugging but I picked two big headliners that a surprising amount of developers aren't familiar with. E.g. How many times did you step over a return statement and cursed?
The original object isn't saved anywhere and you do not know what the return statement actually returned. Or worse, what if you accidentally stepped over code?
Wait? What happened? Can we go back?
Jump to line is the exact tool that enables that. At the time of this writing, I can guarantee that less than 46 thousand developers used this feature...
But before we proceed, here are the videos (the 2nd and 3rd):
🦆 Duckling the 3rd:
How do you see the value returned from the method you stepped out of?
Also watch expressions, evaluate, change state and object marking which is a pretty amazing little known feature.#CodeNewbie #140SecondDucklings pic.twitter.com/IjUMSCrmc6— Shai Almog (@debugagent) February 22, 2022
Java Return Value
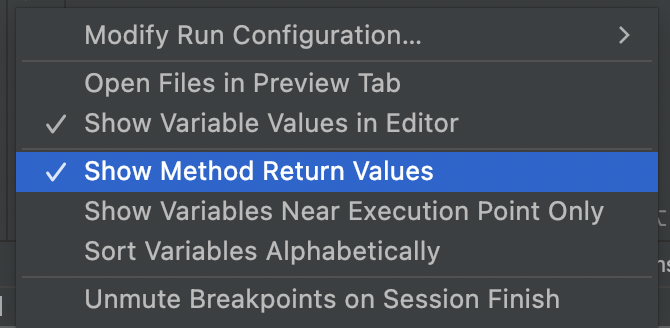
Placing the return value from the method we just stepped out of is remarkably easy. Yet it's off by default. We can enable the "Show method return values" settings option in IntelliJ and it just "magically" works.
This begs the question of: why is this useful feature off by default?
It's something I didn't address in the video due to lack of time.
The reason is performance. The more elements you inspect, the slower the application will be. This means the IDE will bind instrumentation to the return keyword (the underlying bytecode) and collect information every time it's hit.
If the application feels slow, disable such instrumentations. If possible, invest in newer hardware. Especially more RAM. Also, make sure we allocate enough of that RAM for the IDE!
IntelliJ Jump to Line
So how do I know less than 46 thousand developers used this feature?
Easy. It's not a part of the IDE. It's a feature that requires a plugin to support it. Looking at the number of installs, this is a feature that could benefit from some community awareness.
Once installed, you can literally drag the current execution location to a different location. Notice the state of objects isn't changed, so you might need to edit values to get everything working.
This is super useful if you want to re-try something. You step over a method, observe a side effect. Then you can drag execution back and do it over again with different properties. This is immensely useful in narrowing down problems.
It's also useful for testing. We can try a method with different values again and again, then generate use cases for that. We can understand code coverage semantics better without restarting the app.
Object Marking
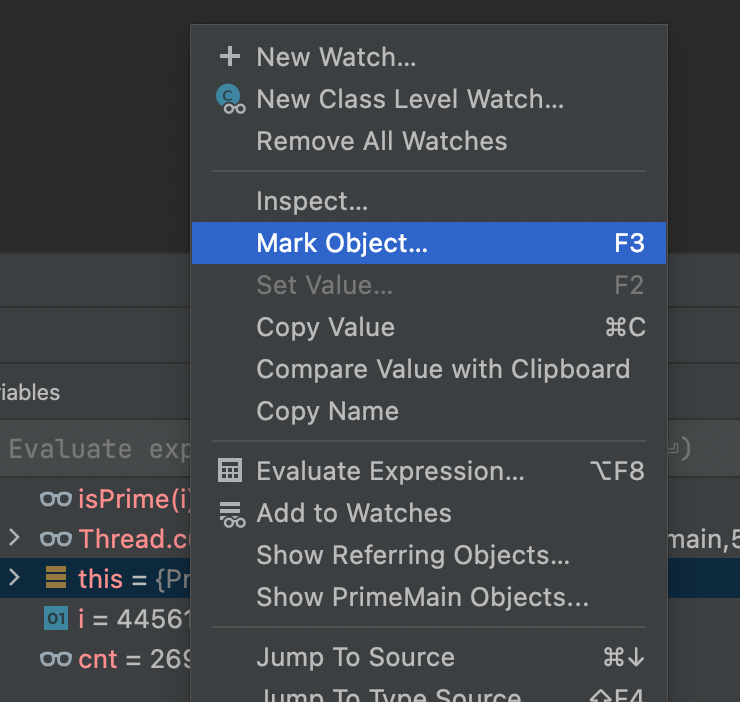
Another feature that's absolutely remarkable and I just don't see in "the real world" is marking. Maybe it's because people just don't understand what it means...
Marking is effectively the declaration of a new reference to an object. Like declaring a new global variable. This is super valuable!
Developers often track issues where they literally write on a piece of paper the object ID (or pointer value) for an object they're looking at. With object marking, we can give an instance a specific global name. We can then reference that instance out of any scope...
E.g. when you're debugging and want to make sure that the object you're looking at in a method is the one that will be sent to another method (and not a cloned copy). Just mark the object with a name. Then, in the other method, compare the argument to the marked object.
You can use this in conditional breakpoints to stop at the right location. It's an amazingly useful feature.
Return Immediately
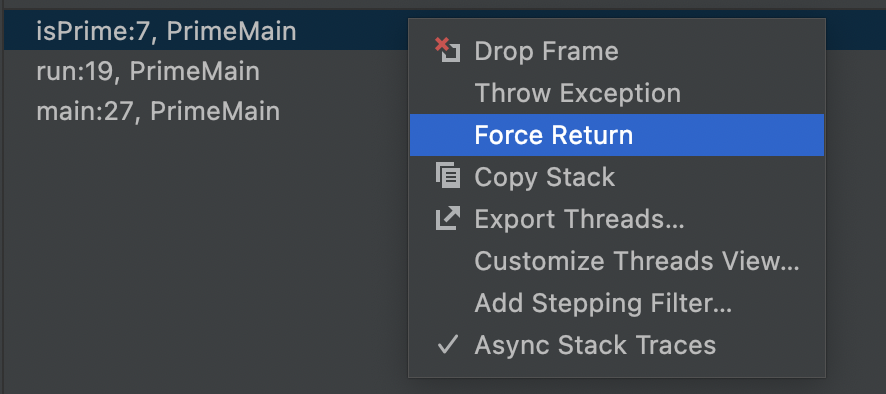
One of the common problems we see when we manipulate state during debugging is the side effects. A method can trigger errors because of that and effectively pollute the entire chain of debugging. It's a waste.
We can "just" force a return from a point before the errors occur and provide a custom own return value. Thus, we can skip a problematic block of code.
This is a pretty niche feature, but when you need it, it's cool!
Drop Frame
This is something I didn't have time for. I plan to cover it in a future video. It's essentially an "undo" of a step into operation. The stack is just unwinded by it. It doesn't restore the state though, so it isn't an exact "undo" operation.
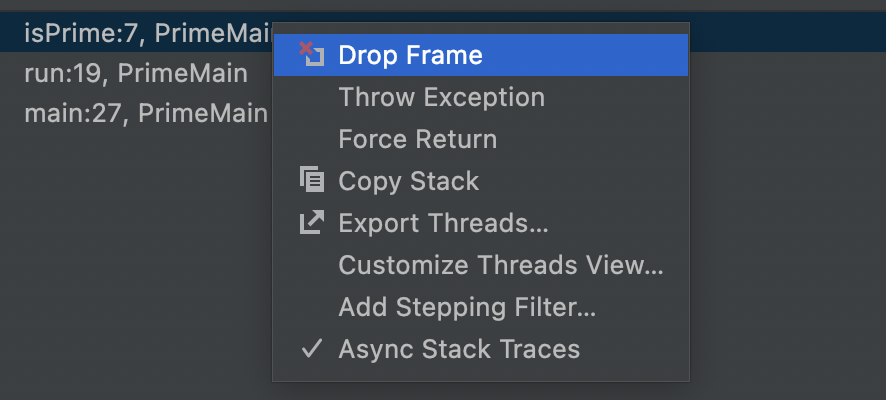
Eagle eyed readers will also notice a feature called "Throw Exception" which does exactly that. Its useful for some edge cases as validating code robustness and failure behavior. I'll try to address that too in the future.
Changing State
Unlike the other features here, many developers change the state of properties during debugging. It's something most developers know about but don't do enough.
We need to keep this in mind when debugging source code and try to use it more.
TL;DR
There are so many features in control flow and debugging. This article barely scratches the surface of what's available to us.
When debugging classes, we need to be aware of all the tools at our disposal.
- March 02, 2022
- 4 min read







Comments (0)
No comments yet. Be the first.