External Debugging Tools 1: dtrace and strace
- August 05, 2022
- 8 min read
Often when debugging, we need to step outside of the comforting embrace of the IDE to reproduce or track an issue.
In this series, I’d like to go over some tools you might find useful for these cases. I’ll try to limit myself to tools that are 100% debugging tools and not those that are useful for development testing.
E.g., tools like curl or jq are remarkably useful. You can/should use them while debugging. But you probably used them while building and testing the feature. So you would already be familiar with them and should have some sense of what they do. I want to focus on tools that you would mostly reach for when debugging. In that sense, tools like SDKMan etc. also make no sense here.
I also want to avoid tools like the database tools. They are remarkably useful when debugging, but again, you’d probably use them during development, too. They’re also very vendor specific, so it’s a vast subject that’s too broad to cover here.
The tools I'll cover in this series encompass the following categories:
- System monitoring tools - as is the case with strace and dtrace, which we'll discuss today
- Network monitors - also fits in the above bracket but warrants a category of its own
- VM/Runtime monitoring - e.g. tools that let us inspect the JVM, etc.
- Profilers and memory monitors
In this first post I'd like to discuss two heavyweight champions: dtrace and strace. If you're a Java developer or a Windows user, there's a good chance you never heard of these tools. You might have inadvertently used one of them since so many tools were built on top of them, but that's probably not the case.
Both tools will let you debug anything without the source code. You could detect problems and gain a level of understanding you never imagined.
Dtrace
Back in 2004, I first heard about DTrace while working at Sun Microsystems. It became all the rage in the hallways as it was an innovation that Sun Microsystems was promoting. Dtrace was ported later into MacOS X (it originated on Solaris). Today there are ports on Windows and Linux as well.
Dtrace is a powerful low level dynamic tracing framework. But that's just another superlative and if you never used such a tool and don't have a background in systems programming, you might be feeling a bit confused: what the hell does it do?
It lets you "see" everything. Want to know which files a process has opened?
OK.
Want to know who invokes a kernel API and get a stack trace to the caller?
OK.
Want to know why a process dies?
OK.
Want to know how much CPU Time is spent on an operation?
OK.
You might think that dtrace is one of those tools that will destroy your CPU completely... But here's the killer feature: it's fast enough to run in production with minimal to no performance impact!
It was revolutionary when it was launched almost two decades ago and it's still the case to this day!
Running Dtrace
Before we begin, a word of warning. Save your data!
This tool can easily crash your machine and enabling it requires disabling important security facilities on MacOS. This is a risky "low level" system service and should be treated as such...
On a Mac dtrace conflicts with "System Integrity Protection" which is a security feature that blocks some interactions between processes (among other things). Under normal circumstances, this would be great. But if you want to run dtrace this would be a problem.
The solution is booting to recovery mode on Intel Macs; this means holding the Command-R keys on boot. On an ARM mac just long-press the power button.
Then, in a recovery mode terminal, issue the command: csrutil disable.
Then upon reboot, dtrace should work as expected.
Basic Usage
As mentioned before, dtrace is a very powerful tool. There are whole books written about it. It has its own programming language based on C syntax that you can use to build elaborate logic. E.g. the following command will log some information from the given callbacks:
sudo dtrace -qn 'syscall::write:entry, syscall::sendto:entry /pid == $target/ { printf("(%d) %s %s", pid, probefunc, copyinstr(arg1)); }' -p [PID]
The code snippet passed to the dtrace command listens to the sendto callback on the target process ID. Then prints out the information to the console, e.g.: (pid) text
If this seems like a bit too much and too hard to get started with... You're 100% right. It's a powerful tool when you need it. But for most of our day-to-day usage, it's just too powerful. What we want is to know a bit of basic stuff and this is just too much!
Simple Usage
As luck would have it, we have a simple solution:
man -k dtrace
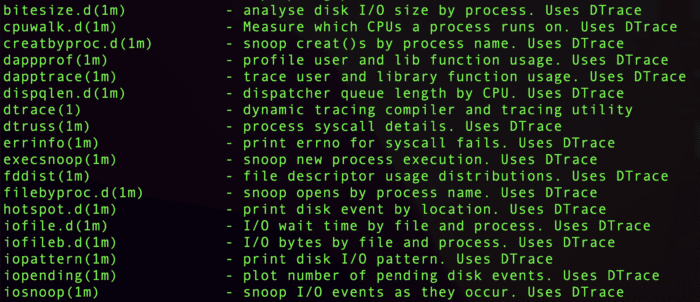
This prints out a list of tools that's worth reading just to get a sense of how extensive this thing is. Here are a few interesting lines of output from that command:
bitesize.d(1m)           - analyse disk I/O size by process. Uses DTrace
dapptrace(1m)            - trace user and library function usage. Uses DTrace
errinfo(1m)              - print errno for syscall fails. Uses DTrace
iotop(1m)                - display top disk I/O events by process. Uses DTrace
plockstat(1)             - front-end to DTrace to print statistics about POSIX mutexes and read/write locks
It's worth your time going over this list to realize what you can truly do here.

Examples
You're facing elevated disk write issues that are causing the performance of your application to degrade... But is it your app at fault or some other app?
Just run:
sudo rwbypid.d
It will print out the reads/writes to the disk:
   PID CMD                       DIR    COUNT
  2957 wordexp-helper              W        1
  2959 wc                          W        1
  2961 grep                        W        1

... snipped for clarity ...

   637 firefox                     R     6937
   637 firefox                     W    15325
   343 sentineld                   W   100287
The security software is really holding performance down...
You can also use bitesize.d to get more specific results on the number of bytes written/distribution.
That's pretty high level though. What if you want specifics: file name, process name, etc?
sudo iosnoop -a
Prints out output that includes pretty much everything you would need:
STRTIME              DEVICE  MAJ MIN   UID   PID D      BLOCK     SIZE                     PATHNAME ARGS
2022 Jun 30 12:16:56 ??        1  17   501  1111 W  150777072     4096 ??/idb/3166453069wcaw.sqlite-wal firefox\0
2022 Jun 30 12:16:56 ??        1  17   501   661 W  150777175   487424  ??/index-dir/the-real-index Slack Helper\0
2022 Jun 30 12:16:57 ??        1  17   499   342 W  150777294     4096 ??/persistent/.dat.nosync0156.ztvXap sentineld\0
I can see the process id and how many bytes it wrote to the specific file!
Let's say your program spans processes and you want to see what's going on. E.g. I run a source code build in a server I built:
sudo errinfo
Lets me detect the error returned from system calls to and the command that originally triggered that:
         EXEC          SYSCALL  ERR  DESC
 WindowServer workq_kernreturn   -2
 WindowServer workq_kernreturn   -2
SentinelAgent workq_kernreturn   -2
SentinelAgent workq_kernreturn   -2
       Signal           Helper    0
       Google           Chrome    0
        Brave          Browser    0
       Google           Chrome    0
These are just the tip of the iceberg. I suggest checking out this old dtrace tutorial from Oracle or the book. Disclaimer: I didn't read the book...
strace
Amusingly enough, the strace tool also originated at Sun Microsystems in this case in the 90s. This isn't surprising though as the list of technologies originating from Sun Microsystems is absolutely mind numbing.
Strace is much simpler than dtrace in both usage and capabilities. For better and for worse. Since dtrace requires deep OS support, it never became an official feature of common Linux distributions and as a result on Linux people use strace instead of dtrace. They aren't exactly interchangeable, though.
Strace is enabled thanks to the kernel feature known as ptrace. Since ptrace is already in Linux, we don't need to add additional kernel code or modules. Typically, dtrace requires deeper kernel support, to get around licensing issues on Linux it's in a separate loadable module but that still presents some challenges.
Working with strace is akin to printing a log entry every time we make a kernel call. This creates very verbose logging for every command you execute. As a result, you can follow what's really going on under the hood of a running process.
Running Strace
Nowadays, strace is commonly used in Linux, it's my favorite system diagnostic tool on that platform. It's remarkably convenient to work with since we can run it with no special privileges. Notice that unlike dtrace, you should keep strace away from production environments (unless the code is segregated). It carries a significant performance overhead and would bring a production system down.
The most basic usage of strace is just passing the command line to it:
strace java -classpath. PrimeMain
The output of strace for this is pretty long, lets go over a few of the lines:
execve("/home/ec2-user/jdk1.8.0_45/bin/java", ["java", "-classpath.", "PrimeMain"], 0x7fffd689ec20 /* 23 vars */) = 0
brk(NULL)                               = 0xb85000
mmap(NULL, 4096, PROT_READ|PROT_WRITE, MAP_PRIVATE|MAP_ANONYMOUS, -1, 0) = 0x7f0294272000
readlink("/proc/self/exe", "/home/ec2-user/jdk1.8.0_45/bin/j"..., 4096) = 35
access("/etc/ld.so.preload", R_OK)      = -1 ENOENT (No such file or directory)
open("/home/ec2-user/jdk1.8.0_45/bin/../lib/amd64/jli/tls/x86_64/libpthread.so.0", O_RDONLY|O_CLOEXEC) = -1 ENOENT (No such file or directory)
stat("/home/ec2-user/jdk1.8.0_45/bin/../lib/amd64/jli/tls/x86_64", 0x7fff37af09a0) = -1 ENOENT (No such file or directory)
open("/home/ec2-user/jdk1.8.0_45/bin/../lib/amd64/jli/tls/libpthread.so.0", O_RDONLY|O_CLOEXEC) = -1 ENOENT (No such file or directory)
stat("/home/ec2-user/jdk1.8.0_45/bin/../lib/amd64/jli/tls", 0x7fff37af09a0) = -1 ENOENT (No such file or directory)
Every one of these lines is a Linux system call. We can google each one of them to get a sense of what's going on. Here's a simple example:
open("/home/ec2-user/jdk1.8.0_45/bin/../lib/amd64/jli/tls/x86_64/libpthread.so.0", O_RDONLY|O_CLOEXEC) = -1 ENOENT (No such file or directory)
Java tries to load the pthread library from the tls directory using a system open call to load the file. The exit code of the system call is -1, which means that the file isn't there. Under normal circumstances, we should get back a file descriptor value from this API. Looking in the directory, it seems the tls directory is missing. I'm guessing that this is because of a missing JCE installation. This is probably OK but might have been interesting in some cases.
Obviously, the amount of output is overwhelming sometimes. We usually just want to see things like "which file was opened" and "what's going on with our network calls". We can easily accomplish that by only looking at specific system calls using the -e argument.
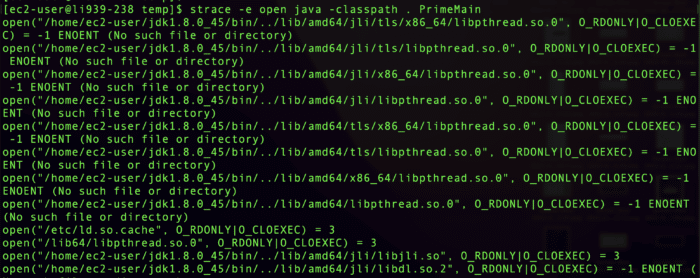
strace -e open java -classpath . PrimeMain
Will only show the open system calls:
open("/home/ec2-user/jdk1.8.0_45/bin/../lib/amd64/jli/tls/x86_64/libpthread.so.0", O_RDONLY|O_CLOEXEC) = -1 ENOENT (No such file or directory)
open("/home/ec2-user/jdk1.8.0_45/bin/../lib/amd64/jli/tls/libpthread.so.0", O_RDONLY|O_CLOEXEC) = -1 ENOENT (No such file or directory)
open("/home/ec2-user/jdk1.8.0_45/bin/../lib/amd64/jli/x86_64/libpthread.so.0", O_RDONLY|O_CLOEXEC) = -1 ENOENT (No such file or directory)
open("/home/ec2-user/jdk1.8.0_45/bin/../lib/amd64/jli/libpthread.so.0", O_RDONLY|O_CLOEXEC) = -1 ENOENT (No such file or directory)
open("/home/ec2-user/jdk1.8.0_45/bin/../lib/amd64/tls/x86_64/libpthread.so.0", O_RDONLY|O_CLOEXEC) = -1 ENOENT (No such file or directory)
open("/home/ec2-user/jdk1.8.0_45/bin/../lib/amd64/tls/libpthread.so.0", O_RDONLY|O_CLOEXEC) = -1 ENOENT (No such file or directory)
open("/home/ec2-user/jdk1.8.0_45/bin/../lib/amd64/x86_64/libpthread.so.0", O_RDONLY|O_CLOEXEC) = -1 ENOENT (No such file or directory)
open("/home/ec2-user/jdk1.8.0_45/bin/../lib/amd64/libpthread.so.0", O_RDONLY|O_CLOEXEC) = -1 ENOENT (No such file or directory)
open("/etc/ld.so.cache", O_RDONLY|O_CLOEXEC) = 3
open("/lib64/libpthread.so.0", O_RDONLY|O_CLOEXEC) = 3
open("/home/ec2-user/jdk1.8.0_45/bin/../lib/amd64/jli/libjli.so", O_RDONLY|O_CLOEXEC) = 3
open("/home/ec2-user/jdk1.8.0_45/bin/../lib/amd64/jli/libdl.so.2", O_RDONLY|O_CLOEXEC) = -1 ENOENT (No such file or directory)
There are many system calls you can learn and use to track many behaviors such as this: connect, write, etc. This is only the tip of the iceberg of what you can do using strace. Julia Evans wrote some of the most exhaustive and entertaining posts on strace. If you want to learn more about it, there's probably no better place (also check out her other stuff... Amazing resources!).

Strace and Java
As you saw before, strace works great with the JVM. Since strace predates Java and is a very low level tool, it has no awareness of the JVM. The JVM works like most other platforms and invokes system calls which you can use to debug its behavior. However, because of its unique approach to some problems, some aspects might not be as visible with strace.
A good example is allocations. System tools use malloc, which maps to kernel allocation logic, but Java takes a different route. It manages its own memory for efficiency and easier garbage collection logic. As a result, some aspects of memory allocation will be hidden from strace output. This can be a blessing in disguise, as the output can be overwhelming sometimes.
At the time of this writing, threading works well with strace. But this might not be the case moving forward as project Loom might change the one-to-one mapping between Java threads and system threads. This might make strace output harder to pinpoint in heavily threaded applications.
Finally
There's an alphabet soup of "*trace" utilities in various forms that keep borrowing ideas from one another. It's a significant challenge to keep up with all of that noise. There are just too many great tools to cover, I would like to discuss btrace in a future installment though. It's very similar to dtrace but also very JVM specific so probably worth a different post.
The tools I discussed today take different approaches to solve similar problems: how do we understand what a binary application "really" does? Security researchers and hackers use these tools to understand your program. They don't need the code and don't need a disassembly to see what you're actually doing.
You can also use these tools to understand the impact of your actions. We often invoke an API and let things end there. But the devil is in the details and those details can carry a heavy toll. As a Java developer, I rarely think about signal delivery, process management or such low-level staples. But I do spend time looking at these things since they ultimately impact the stability and performance of my application.
- August 05, 2022
- 8 min read


Comments (0)
No comments yet. Be the first.