External Debugging Tools 3: JMXTerm
- August 26, 2022
- 4 min read
When tracking a bug we need to take a two pronged approach. Similar to tongs that wrap the buggy module from both sides and squeezes to find the problematic part. Up until now we discussed tools that are very low level. Some can be used to debug system level services. Today we’ll discuss the other side of the stack but still a very advanced management tool. To understand this you need to understand the field we’re in.
As developers we deal with code and applications. Deployment is for OPS/DevOps and the tooling they use is often alien to us. It’s not that they have bad tools. On the contrary, they have amazing tools. But they’re usually designed for massive scale. When you need to manage thousands of servers you need a way to control things in all of them. For that we need a different set of tools.
Management tools let us traverse through clouds of machines and manage the applications running on them. We don’t need the former, but the latter is a powerful tool that’s very useful for developers. There are some standards that implement application management, Java introduced JMX to encapsulate their differences. JMX let’s applications, and the JDK itself, expose information and functionality for manipulation by external tools.
This is a remarkable feature that exposes information and tuning levers, for dynamic manipulation in runtime environments. Activating JMX is outside the scope of this tutorial so I won’t go too much into detail but you can check some of the basics in this Oracle article here. Once we have this running we can use visual tools to debug but I’ll focus on command-line tooling. This is important since I can use some of this tooling directly on the production servers right from the console.
How does JMX Work?
JMX exposes management “beans” (MBeans), these are objects that represent control points in the application. Your application can publish its own beans which lets you expose functionality for runtime monitoring and configuration. This is very cool as you can export information that an administrator can wire directly to a dashboard (APM, Prometheus, Grafana, etc.) and use that for decision making.
If your server has multiple users connected concurrently you can expose that number in JMX and it can appear in the company dashboard thanks to some wiring from DevOps. On your side most of the work would be exposing a getter for the value of interest. You can also expose operations such as “purge users”, etc. An operation is a method you can invoke on a JMX bean.
Spring also supports exposing a lot of server details as management beans via actuator. This is a remarkably cool feature, you can read more about it here. It exposes very deep metrics about the application and helps you jump right into “production ready” status!
JMXTerm Basics
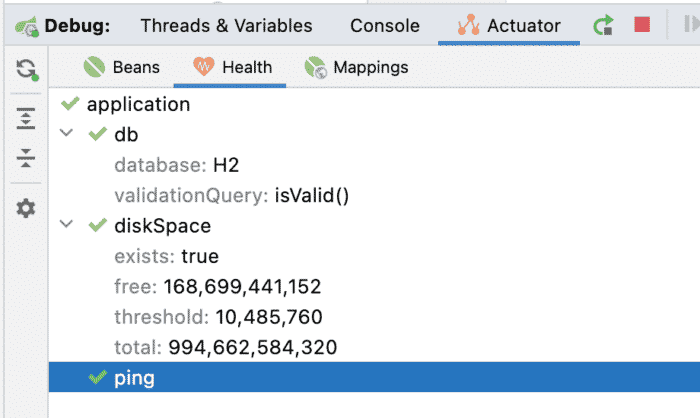
Usually one controls and reads JMX via web interface tools or dedicated administration tooling. If you have access to any of them I suggest you pick one of them up and use them as it would work pretty well. I’ve used some of those in some companies and I actually prefer them in some cases. I also enjoy using IntelliJ/IDEA Ultimates support for Actuator which is a pretty powerful visualization tool:

JMXTerm is just as powerful but doesn’t include the visualization aspect, in that sense it’s exceptionally convenient when we need to understand something quickly on a server that might be alien. It’s also pretty useful for getting high level insights from the server internals. We can get started by downloading JMXTerm from here.
Once downloaded we can use it to connect to a server using:
java -jar ~/Downloads/jmxterm-1.0.2-uber.jar --url localhost:30002
You should update the hostname/port based on your connection. Once connected we can list the JMX domains using the prompt:
> domains #following domains are available JMImplementation com.sun.management java.lang java.nio java.util.logging javax.cache jdk.management.jfr
We can then pick a specific domain to explore. This is where the visual tool is usually beneficial as it can provide you with faster navigation through the hierarchy and quick assessment of the information. In this case I just want to set the logging level:
> domain java.util.logging #domain is set to java.util.logging
We can follow this by listing the beans within the domain. Then pick the bean that we wish to use since there’s only one bean in this specific domain:
> beans #domain = java.util.logging: java.util.logging:type=Logging
> bean java.util.logging:type=Logging #bean is set to java.util.logging:type=Logging
What can I do with this bean? For that we have the info command that lists the operations and attributes of the bean:
> info #mbean = java.util.logging:type=Logging #class name = sun.management.ManagementFactoryHelper$PlatformLoggingImpl # attributes %0 - LoggerNames ([Ljava.lang.String;, r) %1 - ObjectName (javax.management.ObjectName, r) # operations %0 - java.lang.String getLoggerLevel(java.lang.String p0) %1 - java.lang.String getParentLoggerName(java.lang.String p0) %2 - void setLoggerLevel(java.lang.String p0,java.lang.String p1) #there's no notifications
Once I have these I can check the current logger level, it isn’t set since we didn’t set it explicitly and the global default is used:
> run getLoggerLevel "org.apache.tomcat.websocket.WsWebSocketContainer" #calling operation getLoggerLevel of mbean java.util.logging:type=Logging with params [org.apache.tomcat.websocket.WsWebSocketContainer] #operation returns:
I can explicitly set it to INFO and then get it again to verify that the operation worked as expected using this code:
> run setLoggerLevel org.apache.tomcat.websocket.WsWebSocketContainer INFO #calling operation setLoggerLevel of mbean java.util.logging:type=Logging with params [org.apache.tomcat.websocket.WsWebSocketContainer, INFO] #operation returns: null
> run getLoggerLevel "org.apache.tomcat.websocket.WsWebSocketContainer" #calling operation getLoggerLevel of mbean java.util.logging:type=Logging with params [org.apache.tomcat.websocket.WsWebSocketContainer] #operation returns: INFO
This is just the tip of the iceberg. We can get many things such as spring settings, internal VM information, etc. In this example I can query VM information directly from the console:
> domain com.sun.management #domain is set to com.sun.management
> beans #domain = com.sun.management: com.sun.management:type=DiagnosticCommand com.sun.management:type=HotSpotDiagnostic
> bean com.sun.management:type=HotSpotDiagnostic #bean is set to com.sun.management:type=HotSpotDiagnostic
> info #mbean = com.sun.management:type=HotSpotDiagnostic #class name = com.sun.management.internal.HotSpotDiagnostic # attributes %0 - DiagnosticOptions ([Ljavax.management.openmbean.CompositeData;, r) %1 - ObjectName (javax.management.ObjectName, r) # operations %0 - void dumpHeap(java.lang.String p0,boolean p1) %1 - javax.management.openmbean.CompositeData getVMOption(java.lang.String p0) %2 - void setVMOption(java.lang.String p0,java.lang.String p1) #there's no notifications
Finally
JMX is a remarkable tool that we mostly use to wire management consoles. It’s remarkable for that and you should very much export JMX settings for your projects. Having said that, you can take it to the next level by leveraging JMX as part of your debugging process.
Server applications run without a UI or with deep UI separation. JMX can often work as a form of user interface or even as a command line interface as is the case in JMXTerm. In these cases we can trigger situations for debugging or observe the results of a debugging session right within the management UI.
- August 26, 2022
- 4 min read


Comments (0)
No comments yet. Be the first.