How to profile a performance issue using Spring Boot profiling tools
- September 02, 2024
- 9 min read
- High Latency and Slow Response Times:
- High CPU Usage
- High Memory Usage and Memory Leaks
- Slow Database Queries
- Network Latency and I/O Issues
- Increased Error Rates and Failures
In today’s fast-paced development environment, ensuring the performance and reliability of your services is critical. Imagine you are part of a team responsible for several services essential to both internal teams and external customers. These services are the backbone of various business operations, and any downtime or performance degradation can have significant repercussions.
Now, picture this scenario: your team has not yet implemented a robust monitoring and observability system. One day, you start receiving emails and messages from frustrated clients reporting that your service is down. Panic sets in as your team tries to figure out what went wrong. Without proper monitoring tools, finding the root cause of issues in production is challenging. Persistent downtime increases pressure, affecting business operations and customer satisfaction.
This situation highlights a common but critical challenge: the need for effective performance profiling and monitoring of your Spring Boot applications. Without these tools, you’re essentially flying blind, making it extremely difficult to troubleshoot issues under pressure.
In this article, we explore the tools available for profiling performance issues and understand the scenarios where profiling is crucial. By the end, we’ll delve into features of Digma, empowering developers with insights even during the development phase.
Understanding Various Aspects of Profiling Performance Issues
Profiling a Spring Boot performance issue involves analyzing the application’s runtime behavior to identify and diagnose inefficiencies, bottlenecks, and resource constraints. This includes monitoring CPU and memory usage, thread activity, garbage collection, and database interactions. Profiling tools collect data on method execution times, resource usage, and other performance metrics to help pinpoint the root causes of performance issues.
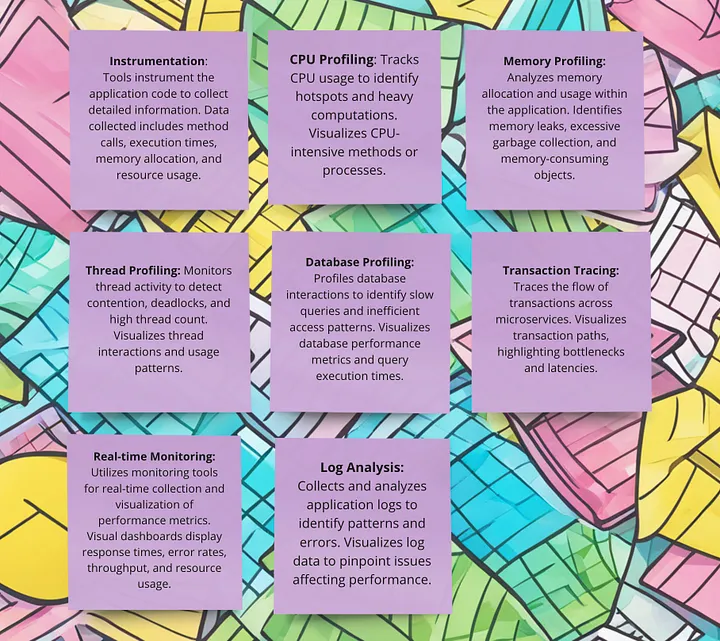
Visualizing Spring Boot Performance Profiling Process
key scenarios where Spring Boot profiling tools are essential
High Latency and Slow Response Times:
1. Analyze the time taken for each layer of the application (e.g., controller, service, repository).
2. Detect inefficient algorithms or processing logic.
High CPU Usage
1. Find CPU-intensive methods or loops that need optimization.
2. Analyze thread dumps to identify threads consuming excessive CPU.
3. Detect performance issues related to garbage collection
High Memory Usage and Memory Leaks
1. Identify memory leaks by analyzing heap dumps.
2. Monitor object allocation and garbage collection activity.
3. Detect excessive creation of short-lived objects that can increase garbage collection overhead.
Slow Database Queries
1. Use database profiling tools to identify slow queries.
2. Optimize SQL queries and database indexes.
3. Monitor connection pool usage to ensure efficient database connections.
Network Latency and I/O Issues
1. Measure the time taken for network calls and external service interactions.
2. Identify slow or failing network connections.
3. Optimize HTTP client configurations and retry mechanisms.
Increased Error Rates and Failures
1. Examine stack traces and error logs to identify the source of exceptions.
2. Identify resource contention issues such as deadlocks or excessive locking.
Profiling in these key cases helps identify and resolve performance bottlenecks, ensuring your Spring Boot application runs efficiently and reliably. By addressing these scenarios, you can enhance user experience, improve resource utilization, and maintain the overall health of your application.
Java and Spring Boot Profiling Tools
To effectively profile performance issues in Spring Boot applications, you can utilize a combination of tools designed for different aspects of performance analysis. JProfiler and YourKit provide deep insights into CPU and memory usage, helping to identify bottlenecks and memory leaks. VisualVM, an open-source profiler, offers real-time monitoring and detailed performance analysis.
Spring Boot Actuator, combined with Micrometer, allows for the collection of detailed application metrics and integration with monitoring systems like Prometheus and Grafana.
Additionally, distributed tracing tools like Zipkin or Elastic APM help trace and diagnose latency issues across microservices. Using these tools together enables comprehensive performance profiling and optimization of your Spring Boot applications.
We wrote a great article you can check out: https://digma.ai/9-best-java-profilers-to-use-in-2024/
JProfiler
A powerful Java profiler that provides comprehensive insights into CPU, memory, and thread usage.
Use Case: Suppose your Spring Boot application is experiencing slow response times. By attaching JProfiler, you can analyze CPU hotspots, identify methods consuming excessive CPU cycles, and optimize them for better performance. For instance, you might discover that a particular database query is inefficient, allowing you to refactor it for improved speed.
VisualVM
Open-source profiling tool that comes bundled with the JDK, offering basic yet effective profiling features.
Use Case: VisualVM can be used to monitor a Spring Boot application running in a production environment. By analyzing heap dumps and monitoring garbage collection, you can ensure that your application maintains optimal memory usage, preventing out-of-memory errors and improving overall stability.
YourKit
Java profiling tool known for its user-friendly interface and detailed analysis capabilities.
Use Case: If your application suffers from memory leaks, YourKit can help. By profiling your Spring Boot application, you can track memory allocation, identify objects that are not being garbage collected, and pinpoint the root cause of memory leaks. This enables you to clean up unused objects and improve memory management.
Digma
Innovative platform that introduces Continuous Feedback to the development cycle. It automates the discovery of performance issues and conducts Root Cause Analysis (RCA) effortlessly.
Use Case: With Digma, developers can swiftly detect bottlenecks in their Spring Boot applications. By profiling the application, Digma identifies areas of inefficiency and provides detailed insights into why these issues occurred. This enables developers to optimize their code for improved performance and reliability.
We will explore more on this article.
Spring Boot 3 built-in tools for monitoring and observability
Monitoring and performance profiling are distinct yet complementary. Monitoring provides continuous visibility and alerts to potential issues, while profiling offers the detailed analysis needed to diagnose and fix those issues. By integrating both approaches, teams can ensure their Spring Boot applications run efficiently and reliably
When it comes to monitoring and maintaining the performance of Spring Boot applications, Spring Boot provides several built-in tools that can help you track your applications’ health, metrics, and other vital statistics. Here are some key built-in tools and features:
Actuator
Spring Boot Actuator provides production-ready features to help you monitor and manage your application. With Actuator, you can expose various endpoints that give insight into the application’s state and performance.
Health Checks: The /actuator/health endpoint provides detailed information about the health of the application and its components.
Metrics: The /actuator/metrics endpoint exposes various application metrics such as memory usage, CPU usage, and HTTP request statistics.
Info Endpoint: The /actuator/info endpoint can display arbitrary application information, which can be useful for showing version numbers or build information.
Environment: The /actuator/env endpoint exposes properties from the Spring Environment, including system properties and configuration properties.
Micrometer
Micrometer is an application metrics facade that supports numerous monitoring systems, including Prometheus, Graphite, and more. Spring Boot integrates Micrometer to collect metrics and send them to the desired monitoring system.
Rich Metrics Collection: Collects JVM metrics, HTTP request metrics, and custom application metrics.
Integration with Monitoring Systems: Supports integration with Prometheus, Grafana, Datadog, New Relic, and more.
Comparison
- Profiling dives deep into the performance details of specific parts of an application to optimize and improve efficiency.
- Monitoring is about tracking the health and performance of an application in real time.
- Observability provides a holistic view of an application’s state by combining metrics, logs, and traces to understand not just what is happening but why it is happening.
Using Digma for Early Detection and Profiling of Spring Boot Performance Issues
Digma is a Continuous Feedback platform designed to integrate observability directly into the development process. It aims to help developers gain real-time insights into their code’s performance, scalability, and potential issues right from their Integrated Development Environment (IDE). By doing this, Digma enables developers to identify and address problems early in the development cycle, improving overall code quality and reducing production issues.
Requirements
- Set up your spring boot application
- Add the Digma plugin to your development environment.
- Add observability to your code
- Install and set up JMeter.
This setup includes a sample Spring Boot application with an inefficient query. The query retrieves all products from the database and sorts them by their sales count in descending order.
Let’s assume we have an Product entity.
@Entity
public class Product {
    @Id
    @GeneratedValue(strategy = GenerationType.IDENTITY)
    private Long id;
    private String name;
    private int sales;
    // Getters and Setters
}
Create a repository interface with a method including a query.
package com.example.demo.service;
import com.example.demo.entity.Product;
import com.example.demo.repository.ProductRepository;
import org.springframework.beans.factory.annotation.Autowired;
import org.springframework.stereotype.Service;
import java.util.List;
@Service
public class ProductService {
    @Autowired
    private ProductRepository productRepository;
    @WithSpan
    public List<Product> getBestSellingProducts() {
        return productRepository.findBestSellingProducts();
    }
}
Create a controller to handle HTTP requests.
package com.example.demo.controller;
import com.example.demo.entity.Product;
import com.example.demo.service.ProductService;
import org.springframework.beans.factory.annotation.Autowired;
import org.springframework.web.bind.annotation.GetMapping;
import org.springframework.web.bind.annotation.RestController;
import java.util.List;
@RestController("/api/v1/products")
public class ProductController {
    @Autowired
    private ProductService productService;
    @Observed
    @GetMapping("/best-selling")
    public List<Product> getBestSellingProducts() {
        return productService.getBestSellingProducts();
    }
}
Run your Spring Boot application and test the endpoints. You can use a tool like Postman or simply your web browser to send GET requests to:
Simulate high traffic using Jmeter.
Use load testing tools like Apache JMeter, Gatling, or Locust to generate a high volume of requests to your endpoints. This will help us to generate insight into Digma.
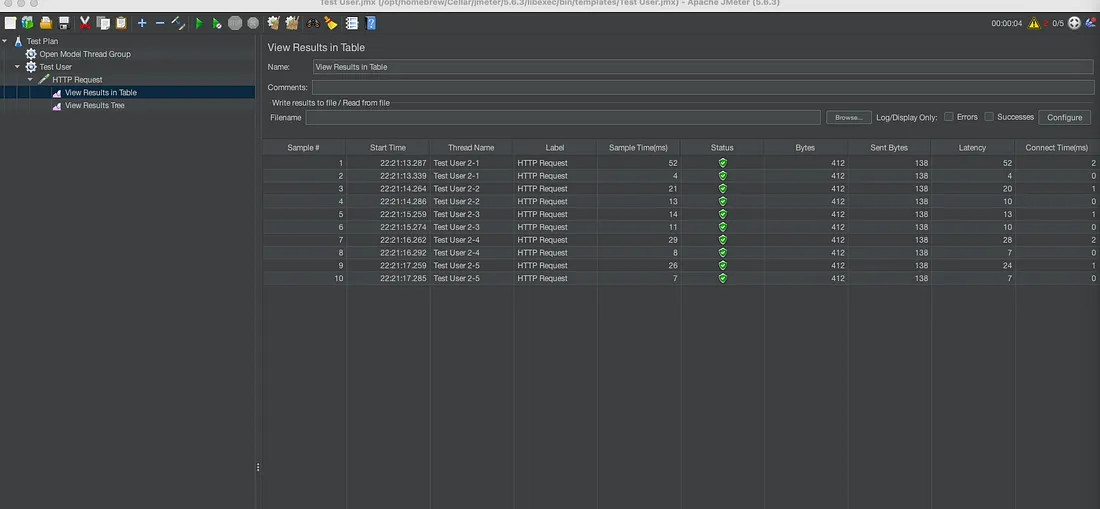
Let’s look at Digma’s features for understanding performance issues and analyzing our application.
Duration
The duration feature in Digma provides comprehensive insights into the performance of your application, particularly focusing on how long specific operations take to complete. This feature aggregates duration statistics for selected assets, allowing you to monitor and analyze performance trends over time. By utilizing this feature, you can identify recent changes in performance and understand how different parts of your application behave under various conditions.
In observability, we can see all recent calls, and by clicking on calls we get to see the insights.

Last Call Duration:
The duration of the most recent call to the endpoint. This is a snapshot of how long the last request took to process.
Median Duration:
The median value indicates that half of the requests to this endpoint are processed in less than 1.93 milliseconds, and half take longer. This is a good measure of typical performance.
Slowest 5%:
The slowest 5% of the requests take 6.69 milliseconds or longer. This highlights the tail latency, showing the worst-case scenarios for this endpoint.
By leveraging the detailed insights provided by Digma’s duration feature, you can maintain optimal performance for your endpoints, ensure a smooth user experience, and proactively address any issues that arise.
Scaling Issues:
Digma’s scaling issue insight delves into the performance of your code when subjected to concurrent operations, offering an in-depth analysis of its behavior under load. This feature not only identifies any performance bottlenecks but also automatically investigates the root cause of any detected issues, providing valuable insights for optimizing your application’s scalability and efficiency.

This alert indicates that the performance of “/best-selling” endpoint degrades as the number of concurrent requests increases. The constant degradation suggests a potential problem with the scalability of this endpoint, which could affect user experience and system performance under load.
- Duration: The response time for the API calls ranges from 16.57 milliseconds to 679.56 milliseconds.
- Ticket: This option allows you to create a ticket for further investigation and resolution of the issue.
By simulating multiple simultaneous user interactions, Digma’s scaling issue insight offers a comprehensive understanding of your system’s performance characteristics, empowering you to fine-tune your code and infrastructure for enhanced reliability and responsiveness under varying workloads.
Bottleneck
The bottleneck feature is crucial for identifying parts of your application that cause delays, enhancing overall performance. It highlights specific assets, such as methods, services, or database queries, that consume the most time during request processing.
By distinguishing between synchronous and asynchronous executions, it ensures that only blocking assets are marked as bottlenecks, allowing developers to focus on critical paths that directly impact user experience.
We can add another method that simulates a more time-consuming process:
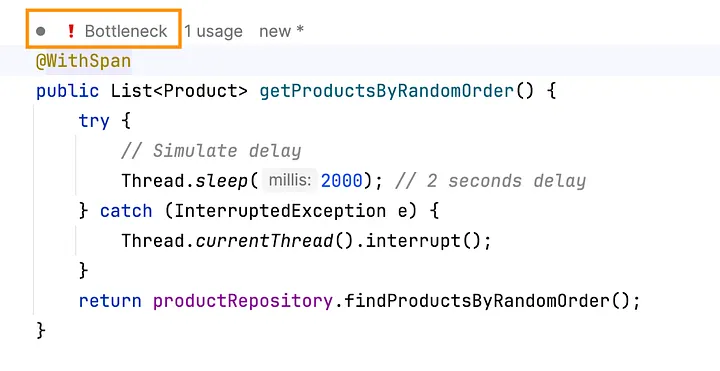
The bottleneck feature helps identify parts of your system that are causing delays by taking up a lot of processing time during a request. It points out which components are slowing things down and could potentially impact the overall performance of your application.
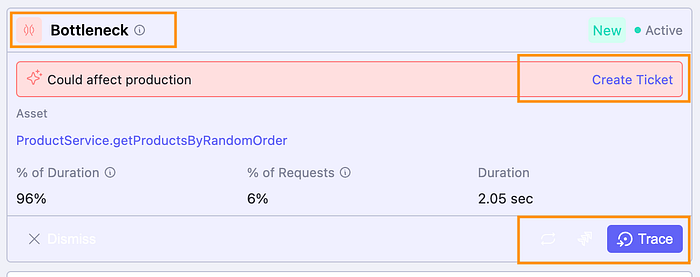
Performance Metrics:
% of Duration:
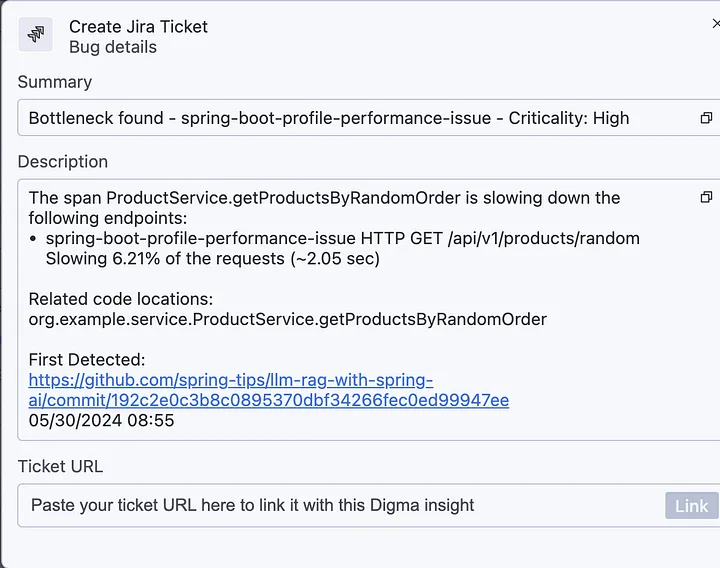
This indicates that the identified method (getProductsByRandomOrder) is consuming 96% of the total time for the request.
% of Requests:
This means that 6% of the requests are invoking this particular method.
Duration:
The method takes 2.05 seconds to execute, which is significantly high and likely the cause of the bottleneck.
It is possible to create tickets for issues detected by Digma
Final thoughts: Spring Boot Profiling Tools
Profiling performance issues and establishing robust monitoring and observability are critical for maintaining the health and efficiency of your Spring Boot application. Profiling helps identify and resolve bottlenecks, inefficient code, and resource-intensive processes, ensuring the application performs optimally under various loads.
Concurrently, having comprehensive monitoring and observability allows you to track key performance metrics, detect anomalies in real time, and gain insights into the application’s behavior. This dual approach not only enhances the user experience by reducing latency and preventing downtime but also enables proactive maintenance, reducing the risk of unexpected failures and facilitating continuous improvement in the application’s performance and reliability.
- September 02, 2024
- 9 min read


Comments (1)
Java Weekly, Issue 558 | Baeldung
2 years ago[…] >> How to profile a performance issue using Spring Boot profiling tools [foojay.io] […]