


Inside the Engine: The Sub-Millisecond Performance Relay of MongoDB 8.0
- December 16, 2025
- 5 min read
- Stage 1: Network Arrival & Task Dispatch
- Stage 2: OperationContext & ACL/Parsing
- Stage 3: PlanCache Lookup & Query Planning
- Stage 4: SBE Execution & Cooperative Yielding
- Stage 5: WiredTiger MVCC, Cache & Journaling
- Stage 6: Index Mastery & Pre-Splits
- Stage 7: Replication & Transactional Guarantees
- Stage 8: Mongos Routing & Sharding Precision
- Stage 9: Change Streams & CDC Flow Control
- Stage 10: Time-Series Buckets & Query Optimization
- Stage 11: Backup, PITR & Rapid Recovery
- Stage 12: Monitoring, Alerts & CI-Driven Tuning
- Conclusion

In environments where microseconds dictate competitive advantage, MongoDB 8.0 delivers a meticulously tuned execution pipeline that transforms raw network packets into sub-millisecond query responses at global scale.
This reference traces a single trade query through every internal boundary network ingress, scheduling, security, parsing, planning, execution, storage‐engine internals, indexing, replication, sharding, change streams, time‐series buckets, backup, and monitoring illustrating how MongoDB 8.0’s per-CPU allocators, active-work profiling, SIMD-vectorized execution, adaptive bucketization, compact resume tokens, and refined journaling coalesce into a seamless, predictable performance engine.
Stage 1: Network Arrival & Task Dispatch
At 09:30:45.123 UTC, your Node.js driver pulls a TLS session from its pool and emits:
db.trades.find({ symbol: "AAPL" })
         .sort({ timestamp: -1 })
         .limit(10);
The NIC DMA’s the encrypted packet into kernel memory and, within microseconds, MongoDB’s ASIO reactor (mongo::transport::ServiceEntryPoint) zero-copies it into a pre-allocated SocketFrame. That frame lands on the TaskExecutor’s lock-free queue, waking a parked worker thread in under 10 µs. With network I/O complete, control transfers seamlessly to scheduling.
Stage 2: OperationContext & ACL/Parsing
The awakened thread immediately instantiates an OperationContext containing your session’s causal clusterTime, read/write concerns, transaction state, and kill-operation tokens. Reusing the TLS connection lets the AuthorizationManager return an ACL verdict in ~200 µs from its SCRAM cache.
With permissions verified, the raw BSON enters Command::parse(), unfolding into an AST. JSON Schema validators fire against any collection rules, and the AST canonicalizes normalizing filters, pushing down projections, extracting sort keys before computing a 64-bit fingerprint for the PlanCache. Having canonicalized the query, we now pass the baton to query planning.
Stage 3: PlanCache Lookup & Query Planning
That fingerprint is looked up in PlanCacheImpl. On a cache hit, the cached SBE plan rehydrates instantly and bypasses planning. On a miss, QueryPlanner generates candidates a full-collection scan, an index scan on { symbol: 1 }, and a compound index scan on { symbol: 1, timestamp: -1 }. It trial-runs each against the first 128 documents, capturing keysExamined and docsReturned.
The fastest contender compiles into SIMD-vectorized SBE bytecode with in-lined numeric filters and any $convert/$toUUID operators annotated for runtime. Armed with an optimized plan, execution now commences.
Stage 4: SBE Execution & Cooperative Yielding
The SBE engine executes the compiled bytecode, traversing WiredTiger B-tree pages. Every 128 documents or when lock-wait thresholds trigger it cooperatively yields (via internalQueryExecYieldIterations), granting CPU slices to concurrent writes.
Upon completion, CurOp::complete() aggregates active-work latency (excluding lock-wait and journal delays in 8.0), CPU time, I/O counts, and returned-document metrics. If active-work latency exceeds a 2 ms SLA or matches a 10 % sample rate, an atomic profiling document is written to system.profile, maintaining precise diagnostics. With execution metrics captured, the baton transfers to the storage engine.
Stage 5: WiredTiger MVCC, Cache & Journaling
Under the surface, WiredTiger’s MVCC gives each operation its own read snapshot, so readers never block writers; old document versions stream into the history store until eviction threads merge them back into pages.
The WT cache sized to 60 % of RAM monitors dirty pages at an 8 % threshold, flushing asynchronously to avoid foreground stalls. Writes append to the journal file, and a timer thread fsyncs every 20 ms (commitIntervalMs), bounding durability latency; 8.0’s active-work profiling ensures these fsync waits do not appear in slow-op logs.
Meanwhile, per-CPU TCMalloc caches minimize fragmentation on your multi-socket servers. Having persisted and profiled the operation, we transition to indexing.
Stage 6: Index Mastery & Pre-Splits
Your compound index { symbol: 1, timestamp: -1, price: 1 } adheres to the ESR (Equality → Sort → Range) rule, allowing the SBE engine to satisfy the query with a single index scan. You pre-split hot key ranges—invoking:
sh.splitAt("market.trades", { symbol: "H" });
sh.splitAt("market.trades", { symbol: "M" });
// …and so forth through "Z"
eliminating runtime page splits. A VIP partial index on high-price trades:
db.trades.createIndex(
  { price: -1 },
  { partialFilterExpression: { price: { $gt: 1000 } } }
);
ensures premium fetches hit a covered-index probe, bypassing the document layer entirely. With index probes optimized, replication and transactional guarantees take over.
Stage 7: Replication & Transactional Guarantees
Upon commit, the primary writes the corresponding oplog entry to local.oplog.rs and streams it to secondaries within 10 ms. Under a w: "majority" write concern, the majority-commit point advances only after a quorum acknowledges, safeguarding against partitions.
If executed within a multi-document transaction, MongoDB’s two-phase commit protocol prepares changes on each shard’s journal and issues the global commit minimizing cross-shard latency by keeping the prepare window razor-thin. Next, mongos routing and shard-aware dispatch refine the query’s scope.
Stage 8: Mongos Routing & Sharding Precision
Your mongos routers, armed with a 30 s-TTL CatalogCache of config.collections and config.chunks, resolve your hybrid shard key { region: 1, tradeId: "hashed" } plus GDPR-compliant tag ranges (EU vs. APAC).
Queries are dispatched only to shards owning relevant chunks no scatter/gather. Should you need to reverse sharding, sh.unshardCollection("market.trades") tears down the metadata, and sh.moveCollection("logs.events", "shard02") rebalances unsharded data without downtime. Following shard-aware dispatch, change streams deliver updates in real time.
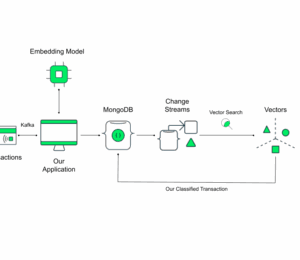
Stage 9: Change Streams & CDC Flow Control
Your analytics service subscribes to a change stream. In MongoDB 8.0, compact resume tokens reduce wire payloads by ~40 %, and any $match in the stream pipeline pushes down to the oplog reader ensuring only pertinent events traverse the network.
If a consumer falls behind by more than 10 MB of buffered events, the server applies back-pressure, pausing oplog forwarding to bound memory usage. Simultaneously, the time-series engine accelerates telemetry workloads.
Stage 10: Time-Series Buckets & Query Optimization
Per-second CPU telemetry ingests into time-series buckets targeting ~1 MB compressed size. Version 8.0’s adaptive bucketizer dynamically adjusts fill thresholds based on data variance, guaranteeing predictable rollover.
Secondary indexes on the meta field leverage prefix-compression and quantile sketches, supplying the query planner with precise cardinality estimates allowing analytics such as “average CPU by host per minute” to execute entirely at the bucket level without full document scans.
As night falls, backup and point-in-time recovery ensure data durability.
Stage 11: Backup, PITR & Rapid Recovery
An on-prem “Atlas-style” backup engine employs a hidden change stream to capture page-level diffs, producing incremental snapshots that reduce RTO to minutes even on multi-petabyte clusters. Continuous Point-In-Time Recovery archives the oplog every 5 s to S3.
Stage 12: Monitoring, Alerts & CI-Driven Tuning
Throughout this relay, Prometheus scrapes serverStatus(), queryStats(), indexStats(), and your custom UDF-exported history-store metrics. Automated alerts trigger on WT eviction > 500 events/sec, slow operations exceeding 1 % of total queries, or oplog lag > 5 s.
Your CI pipeline—powered by YCSB profiles that mimic peak traffic gates every schema, index, and configuration change so that any regression over 10 % in 99th-percentile latencies fails the build. Nightly drift-detection jobs SSH into each mongod, pull the live mongod.conf, diff it against the Git master branch, and auto-file tickets for any deviations.
Conclusion
By meticulously choreographing each stage zero-copy network ingress, lock-free task scheduling, cached ACL checks, AST parsing and canonical fingerprinting, PlanCache acceleration with multi-plan feedback, SIMD-enhanced SBE execution with cooperative yields.
WiredTiger’s MVCC caching and bounded journaling, ESR-ordered index scans with pre-splits, majority-committed replication and lean two-phase commits, tag-aware mongos routing, compact change-stream delivery with back-pressure, adaptive time-series bucketing, incremental backups with fine-grained PITR, and continuous telemetry with CI-gated performance benchmarks you construct a living, breathing performance engine.
MongoDB 8.0’s 2025-grade optimizations ensure deterministic, global sub-millisecond SLAs, and this stage-by-stage blueprint is the definitive guide for engineering enterprise-grade systems with surgical precision.
- December 16, 2025
- 5 min read
Engineering Manager @ Netways


Comments (0)
No comments yet. Be the first.