
Observing Java Applications Running via Docker Compose Using OpenTelemetry
- August 09, 2023
- 4 min read
An easy non-obtrusive way to collect data about your dockerized app without changing your existing docker-compose.yml or docker files!
This is just a neat trick that I discovered when I was trying to collect OTEL data about my application which was running via Docker Compose. I was trying to understand more about the code using tracing. However, I definitely didn’t want to modify any of the code or deployment-related artifacts, or risk checking in any changes by mistake.
Turns out, there is a simple way to collect observability data from your application running via Docker Compose without changing the original docker-compose.yml file. We can simply use an override file that will add the OTEL agent and set the appropriate environment variables which we can use in dev/test. Let’s see how it’s done:
1. Download the agent and any extension you wish to use
For convenience, you can download the files into a path that is relative to the Docker Compose file location.
curl --create-dirs -O -L --output-dir ./otel https://github.com/open-telemetry/opentelemetry-java-instrumentation/releases/latest/download/opentelemetry-javaagent.jar
2. Add a docker-compose override file
Create a file docker-composer.override.otel.yml which we’ll use to extend the original compose file. We’ll add volumes and the env. variables for configuring the agent.
Add the following code, and replace [your-service] below with the service you wish to instrument:
#docker-compose.override.otel.yml
version: '3'
services:
  [your-service]:
  volumes:
      - "./otel/opentelemetry-javaagent.jar:/otel/opentelemetry-javaagent.jar"
  environment:
   - JAVA_TOOL_OPTIONS=-javaagent:/otel/opentelemetry-javaagent.jar
   - OTEL_SERVICE_NAME=[your-service]
   - DEPLOYMENT_ENV=DOCKER_LOCAL
  extra_hosts:
        - "host.docker.internal:host-gateway"
3. Run the original docker-compose file along with the extended file we just created
docker compose -f docker-compose.yml -f docker-compose.override.otel.yml up -d
WHAT CAN YOU DO WITH THE DATA?
Starting a development stack for observability
We can easily deploy a few containers locally to receive and visualize our observability data using only OSS tools. To make that tasks a little easier, I’ve created a simple development stack that includes the following components: a collector, Jaeger for tracing, Prometheus, and Grafana OSS for metrics.
Download and start the stack:
curl -L -O https://raw.githubusercontent.com/doppleware/developer-observability-oss/main/docker-compose.trace.yml
docker compose -f docker-compose.trace.yml up -dDownload and start the stack:
Start your application with the docker-composer.override.otel.yml file.
After running a few actions on your application, open the Jaeger interface to see the traces at http://localhost:166868
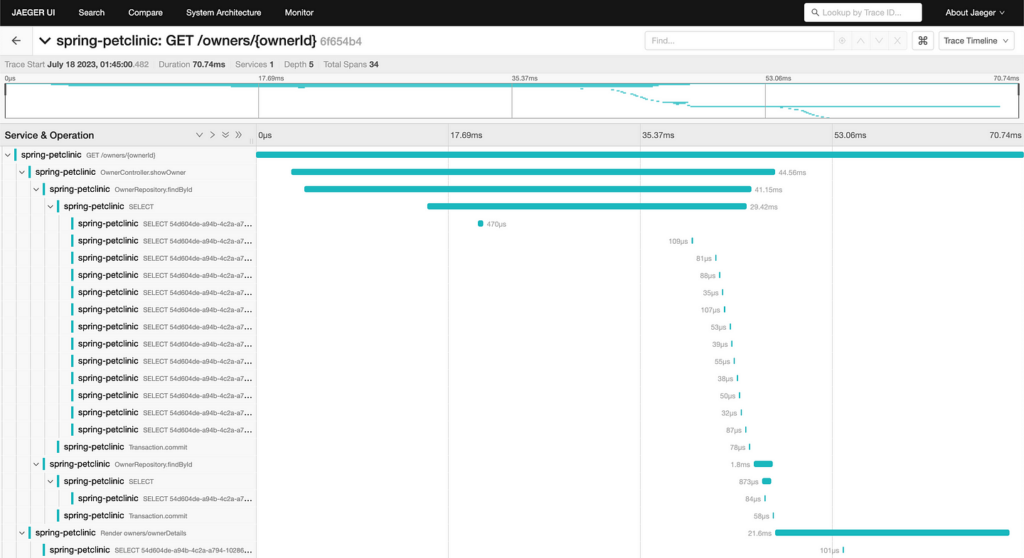
Traces provide a good means to see into the working of your app and services and understand exactly what the code is doing, without having to actively debug it.
Getting more interesting metrics might require you to enable some more settings in your Java application (depending on what framework you’re running). But if you do enable them, you can browse the Grafana OSS deployment and load or create dashboards for your app.
Using Digma for end-to-end analysis
We are writing Digma to be an easy way to analyze dev and test observability data quickly in the IDE, without getting into more YAML configurations.
The benefit is that there are almost no requirements to start using your observability data. The one and only step is to install the Digma IntelliJ plugin from the marketplace. This will let you both collect data while debugging locally as well as from your Docker Compose application.
Digma’s benefit is that it is used not only to collect data but also to analyze your traces and provide feedback about your code, identifying issues, code smells, regressions, bottlenecks, and more.
Similar to the previous example, we start by downloading the OTEL agent, and we’ll also use the Digma OTEL extension to get additional data:
curl --create-dirs -O -L --output-dir ./otel
https://github.com/open-telemetry/opentelemetry-java-instrumentation/releases/latest/download/opentelemetry-javaagent.jar
curl --create-dirs -O -L --output-dir ./otel
https://github.com/digma-ai/otel-java-instrumentation/releases/latest/download/digma-otel-agent-extension.jar
We then modify our override file, adding the extension as well as an environment variable. As before, please update [your-service] with your application name.
#docker-compose.override.otel.yml
version: '3'
services:
  [your-service]:
  volumes:
      - "./otel/opentelemetry-javaagent.jar:/otel/opentelemetry-javaagent.jar"
      - "./otel/digma-otel-agent-extension.jar:/otel/digma-otel-agent-extension.jar"
  environment:
   - JAVA_TOOL_OPTIONS=-javaagent:/otel/opentelemetry-javaagent.jar
   - OTEL_SERVICE_NAME=[your-service]
   - OTEL_EXPORTER_OTLP_ENDPOINT=http://localhost:5050
   - OTEL_METRICS_EXPORTER=none
   - DEPLOYMENT_ENV=DOCKER_LOCAL
  extra_hosts:
        - "host.docker.internal:host-gateway"
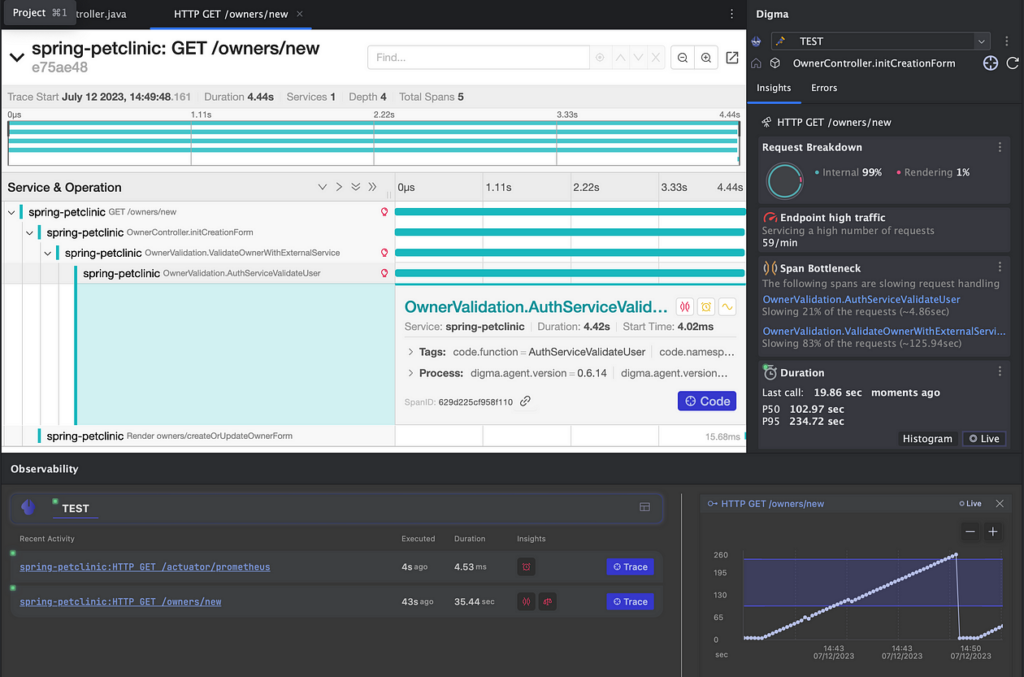
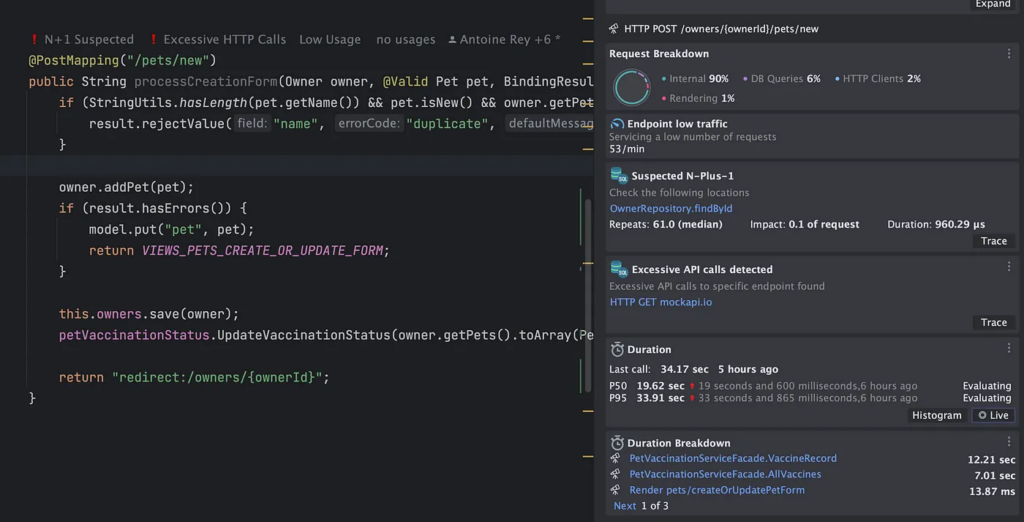
After running our application and triggering some actions, we’ll be able to see the observability info in the IDE, closely integrated with your code:
The idea of Digma is to get Continuous Feedback between code and observability so that you’re always aware of how your changes affect the application.
Now what?
That’s a great question. Getting data about your code is just the prerequisite, the important part is what to do with it — how to transform it into something more meaningful than a science project. In a previous blog post, I wrote about this very question — how to actually use observability data effectively to write better code. I also looked at a few code examples.
Let me know if you’re using observability in your code, using these tools or different ones, and more importantly if you managed to effectively use it in dev!
Happy observing!
- August 09, 2023
- 4 min read
Afflicted by an acute Product Manager/Developer split personality disorder that was never treated. Currently, CTO and co-founder of Digma (digma.ai), an IDE plugin for code runtime AI analysis to help accelerate development in complex codebases. A big believer in evidence-based development, and a proponent of Continuous Feedback in all aspects of Software Engineering.


Comments (0)
No comments yet. Be the first.