

Quest to the OS: Java Native Memory
- April 08, 2022
- 9 min read
As developers we want to spend most time on new features and improvements, providing value to our users or customers. However, all software inevitably contains bugs and other defects. A lot can be done to catch defects before software reaches production (something Picnic’s automated fulfillment center team has previously written about) but some defects are likely to go undetected until the software is in the hands of users.
One such case happened when Picnic’s Distribution Systems team started to get notified that one of its deployments, the Fulfillment Service, was regularly killed and restarted by our Kubernetes cluster. This particular deployment houses many of the planning algorithms employed by Picnic, such as its truck scheduling algorithm.
Luckily we have a broad range of monitoring and observability tools set up across Picnic. After a quick peek at our dashboards we noticed the offending deployment showed continuously growing memory usage, eventually hitting its 6GB limit causing it to be killed.
This scenario is indicative of a memory leak, when resources consuming system memory are allocated but never released. Developers dread such problems, because they’re often tricky to reproduce and resolve. Not easily scared, we launched an investigation into what we assumed to be a memory leak. But after digging into the source of the problem, it turns out this behavior was not a memory leak, or at least not in the conventional sense.
To understand this, we need to embark on a quest into the concept of Java native memory. In this case, we define native memory as an umbrella term for all the memory requested by the JVM from the OS. The JVM can request this memory in a number of ways. We’ll explore each way, reaching progressively lower levels until we get to the core of the Fulfillment Service’s memory problems.
Level 1: Heap
The heap is a JVM construct for memory management. Because of the heap and garbage collection developers don’t have to perform memory allocations themselves. It is backed by physical memory requested from the OS by the JVM. The heap expands automatically based on the application’s needs. However, it is bounded by a minimum and maximum size, specified through the JVM’s -Xms and -Xmx options respectively.
In the case of the Fulfillment Service, -Xmx is set to 4GB, so the heap alone should never exceed our 6GB container limit. This already rules out that the heap is solely responsible. But more interestingly, our dashboard reports only about 2.5GB of heap usage while the Fulfillment Service’s container is already consuming 6GB.
Having determined that Java is the only process running in our container we concluded there must be more to this problem and continued our quest.
Level 2: Off-heap
Any memory the JVM uses besides the heap is considered off-heap. There are a few categories of native memory that the JVM can track by default, such as memory used by the garbage collector, thread stacks, loaded classes, and more. To enable JVM native memory tracking we simply pass it the -XX:NativeMemoryTracking=detail flag, after which running jcmd 1 VM.native_memory (where 1 is our Java process ID) reports all native memory allocations known by the JVM.
Conveniently, our monitoring also tracks all off-heap memory known to the JVM.
However, combining the heap and off-heap memory usage is still far from the 6GB limit. It turns out that there are various cases in which the JVM can allocate native memory without tracking it, taking us to the next level of this quest.
Level 3: Direct Buffers
One specific source of native memory allocations not tracked by JVM native memory tracking is direct byte buffers. Java NIO exposes the possibility to allocate blocks of native memory that can be used by applications for any purpose. The advantage of using direct buffers instead of, for example, byte arrays is that they can be used in lower level operations (like writing to a socket) directly without costly conversion.
Even though the JVM does not track its direct byte buffer memory usage by default, we can measure these buffers’ sizes using a trick involving the DirectByteBuffer class. This class stores the location and size of a single direct byte buffer, so if we sum the size field of all DirectByteBuffer instances we’ll end up with our answer. There are some technicalities though. Firstly, some DirectByteBuffer instances may point at the physical memory owned by other instances (called “viewed” buffers). Secondly, DirectByteBuffer instances whose backing memory is likely already deallocated may still be around (“phantomed” or “phantom-reachable” buffers).
Luckily, there are some tools around to deal with these problems. For instance, IBM’s Eclipse Memory Analyzer extensions have a feature to calculate the size of non-viewed non-phantomed direct byte buffers.
But for us, the Picnic monitoring setup makes it easy to get this data from our production system without resorting to analyzing memory dumps.
Unfortunately, adding this to all the previous sources of native memory usage we still end up with under 4GB of memory out of the 6GB we need to account for. However, we haven’t yet exhausted the possible ways native memory can be allocated by the JVM. So again our quest carries on and we’re now tasked with tracking all native memory allocations.
Level 4: Native Memory allocations through JNI
The final possibility of native memory allocation from the JVM comes from libraries backed by native code. In some cases, it makes more sense to implement functionality as native code, generated by compilers for languages such as C, C++ or Rust. Native code can perform better, or it might be the only way to access certain OS-level functionality. Java allows calling native code through the Java Native Interface (JNI). Code called through JNI manages its own memory, so this memory is not tracked by the JVM and is not automatically cleaned up through garbage collection. In a language like C, memory is managed by calling the malloc and free functions, which respectively request memory from and return memory to the OS. This is far from the complete picture, but more on that in the next level.
These two functions, malloc and free, are implemented in their own library. The default on most flavors of Linux is GNU malloc, but it can be swapped out for other implementations. One such implementation is jemalloc, which conveniently also allows tracking where malloc is being called from. This gives us the opportunity to see whether there are any native functions allocating increasing amounts of memory.
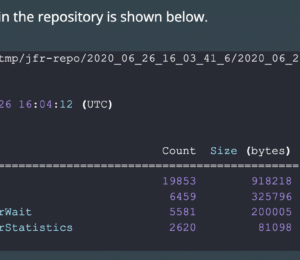
On Linux, jemalloc can be enabled by bundling its shared library with an application and setting the LD_PRELOAD environment variable to the location of libjemalloc.so before running Java. Memory profiling can be enabled through the MALLOC_CONF environment variable. The jemalloc wiki contains some useful examples. You can check the jemalloc man page for a full reference of these options. Now our application writes .heap files after a set volume of allocations. These files can be parsed using the jeprof command into something human-readable.
jemalloc profiling output. Here we see that Unsafe_allocateMemory0 calls malloc. This function is responsible for allocating memory backing the direct byte buffers discussed above.Jemalloc only samples memory allocations instead of measuring every single malloc call to prevent excessive resource consumption. Therefore, the output of jeprof cannot be directly interpreted as the number of bytes currently in use. However, it does allow us to spot any suspicious functions allocating native memory. Additionally, we could also spot functions that are holding on to significantly more memory relative to others (potentially indicating a memory leak).
In our case, we spotted neither. The only functions directly calling malloc were Unsafe_allocateMemory0 and AllocateHeap, both of which are implemented in OpenJDK and were investigated through the other methods explained above. However, after we enabled jemalloc in the Fulfillment Service we observed something interesting: the memory had stopped growing and stabilized around 4GB.
Even though on the surface we had solved our problem, there must be a full explanation for this dramatic change. And our quest ensues, striving to unearth what was going on in the dangerous depths of our JVM’s native memory.
Boss Fight: malloc
If there wouldn’t be advantages to picking one malloc library over the other, there wouldn’t be any competing implementations. In fact, there are a number of different malloc libraries, each having surprisingly different internals. As an example, let’s look at GNU malloc, the malloc implementation originally used by our Fulfillment Service.
Under the hood, GNU malloc uses various data structures to make memory allocations more efficient. One such data structure is a collection of heaps. When the application calls malloc, one of these heaps is searched for a contiguous free chunk of memory big enough to fit the request. When the application calls free, a chunk of the heap frees up, which can be reused by a future malloc call. An important detail is that only the topmost chunk of each heap is available for returning to the OS. All empty chunks in the middle of heaps will technically be unused, but still, count towards the memory the application is using. This is a very simplified view of what’s happening; check the glibc wiki for a complete overview of GNU malloc internals.
malloc heap. A malloc call requests memory. The request does not fit in the lowest free chunk, but does fit in the one above. The lower chunk will remain unused until a request less than or equal its size arrives.As you might imagine, there could be many chunks in the malloc heaps just sitting around empty, depending on the pattern of malloc and free calls an application executes. At this point, we were wondering if this kind of memory fragmentation could explain the Fulfillment Service’s ever-growing memory usage. While investigating possible ways to confirm this, we happened upon an excellent article from the LinkedIn engineering team, describing a problem extremely similar to ours. However, instead of using the gdb-heap tool the LinkedIn team used, we decided to confirm our hypothesis in a slightly more direct way.
It turns out that GNU malloc already exposes some statistics which are suitable for roughly quantifying memory fragmentation. The statistics we are interested in are: the total size of memory in use by the application, the total size of memory in malloc’s heaps but not in use by the application and the part of that memory allowed to be returned to the OS. GNU malloc’s mallinfo function returns these as the uordblks, fordblks and keepcost fields respectively. So, calculating 1 — uordblks / (fordblks — keepcost) gives the ratio of unused memory that cannot be returned to the OS, a measure of memory fragmentation.
Having learned this, we created a local testing setup for the Fulfillment Service. This setup consisted of a Docker container with gdb (the GNU debugger for debugging native code), OpenJDK with debug symbols and glibc with debug symbols. This setup allowed us to attach gdb to the JVM and call the mallinfo function from the gdb prompt.
To measure memory fragmentation we booted this container and locally ran a production-like workload, consisting of a number of steps in the distribution planning process. After running this planning, memory fragmentation was around 80%. This in itself does not say much since it’s likely that part of this memory can be reclaimed during future memory allocations. However, after another planning memory fragmentation was up to 84%, leading us to conclude that each planning leaves behind unused memory that won’t be used again.
The reason this phenomenon disappears when using jemalloc is that the algorithms and data structures in that malloc implementation are specifically designed to put an upper bound on memory fragmentation. Having confirmed that fragmentation was indeed the root cause of our memory issues we decided to enable jemalloc permanently. Since then memory usage has been very well-behaved and the Fulfillment Service has not been killed anymore.
Conclusion
What seemed to be a memory leak eventually took us on a quest all the way down to the level of the OS. This goes to show that even though Java hides a lot of complexity surrounding memory management, sometimes we still need to break out of the comfort of the JVM’s heap and get our hands dirty. In the end, the solution to enable jemalloc was easy to implement. Concluding this was the right solution, however, was definitely non-trivial.
After our investigation it might seem tempting to switch to jemalloc for all workloads within Picnic, but things are not so simple. The Fulfillment Service is under heavy load during plannings while being almost idle the rest of the time. In this case switching to jemalloc did not significantly impact performance and gave us jemalloc’s promised upper bound on memory usage, keeping the service from being killed. However, services with a more evenly distributed load will have a different memory allocation pattern. Therefore, careful benchmarking will be necessary before switching to jemalloc.
- April 08, 2022
- 9 min read
Software Engineer at Picnic


Comments (0)
No comments yet. Be the first.