Validating Java Profiling APIs
- March 16, 2023
- 7 min read
In my last article, I covered a correctness bug in the fundamental Java profiling API AsyncGetCallTrace that I found just by chance.
Now the question is: could we find such bugs automatically?
Potentially uncovering more bugs or being more confident in the absence of errors.
I already wrote code to test the stability of the profiling APIs, testing for the lack of fatal errors, in my jdk-profiling-tester project.
Such tools are invaluable when modifying the API implementation or adding a new API.
In this article, we will cover a new prototypical tool called trace_validation and its foundational concepts.
I focus here on the AsyncGetCallTrace and GetStackTrace API, but due to the similarity in the code, JFR should have similar correctness properties.
The tool took far longer to bring to a usable(ish) state; this is why I didn't write an article last week. I hope to be on schedule again next week.
AsyncGetCallTrace and GetStackTrace
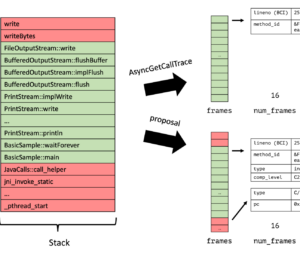
A short recap from my series "Writing a Profiler from Scratch" -- both APIs return the stack trace for a given thread at a given point in time (A called B, which in turn called C, ...):

The only difference is that AsyncGetCallTrace (ASGCT) returns the stack trace at any point in the execution of the program and GetStackTrace (GST) only at specific safe points, where the state of the JVM is defined.
GetStackTrace is the only official API to obtain stack traces but it has precision problems. Both don't have more than a few basic tests in the OpenJDK.
Correctness
But when is the result of a profiling API deemed to be correct? If it matches the execution of the program.
This is hard to check if we don't modify the JVM. But it is relatively simple to check for small test cases where the most runtime is spent in a single method. We can then check directly in the source code whether the stack trace makes sense. We will come back to this answer soon.
The basic idea for automation is to automatically compare the returns of the profiling API to the returns of an oracle. But, we sadly don't have an oracle for the asynchronous AsyncGetCallTrace yet, but we can create one by weakening our correctness definition and building up our oracle in multiple stages.
Weakening the correctness definition
In practice, we don't need the profiling APIs to return the correct result in 100% of all cases and for all frames in the trace. Typical profilers are sampling profilers and therefore approximate the result anyway.
This makes the correctness definition easier to test, as it lets us make the trade-off between feasibility and precision.
Layered oracle
The idea is now to build our oracle in different layers. We are starting with basic assumptions and writing tests to verify that the layer above is probably correct too. This is leading us to our combined test of asynchronous AsyncGetCallTrace.
This has the advantage that every check is relatively simple, which is essential because the whole oracle depends on how much we trust the basic assumptions and the tests that verify that a layer is correct. I describe the layers and checks in the following:

Ground layer
We start with the most basic assumption as our ground layer: An approximation of the stack traces can be obtained by instrumenting the byte code at runtime.
The idea is to push at every entry of a method the method and its class (the frame) onto a stack and to pop it at every exit:
class A {
 void methodB() {
   // ...
 }
}
... is transformed into ...
class A {
 void methodB() {
   trace.push("A", "methodB");
   // ...
   trace.pop();
 }
}
The instrumentation agent modifies the bytecode at runtime, so every exit of the method is recorded. I used the great Javassist library for the heavy lifting. We record all of this information in thread-local stacks.
This does not capture all methods, because we cannot modify native methods implemented in C++, but it covers most of the methods. This is what I meant by an approximation before. A problem with this is the cost of the instrumentation. We can make a trade-off between precision and usefulness by only instrumenting some of the methods.
We can ask the stack data structure to approximate the current stack trace in the middle of every method. These traces are by construction correct, especially when we implement the stack data structure in native code, only exposing the Trace::push and Trace::pop methods. This limits the code reordering by the JVM.
GetStackTrace layer
As I described above, this API is the official API to get the stack traces and it is not limited to basic stack walking, as it walks only when the JVM state is defined. One could therefore assume that it returns the correct frames. This is what I did in my previous article.
But we should test this assumption: We can create a native Trace::check which calls GetStackTrace and checks that all frames of Trace are present and in the correct order. Calls to this method are inserted after the call to Trace::push at the beginning of methods.
There are usually more frames present in the return of GetStackTrace, but it is safe to assume that the correctness attributes approximately holds for the whole GetStackTrace too. One could, of course check the correctness of GetStackTrace at different parts of the methods. This is probably unnecessary, as common Java programs call methods every few bytecode instructions.
This layer now allows us to get the frames consisting of method id and location at safe points.
Safe point AsyncGetCallTrace layer
We can now use the previous layer and the fact that the result of both APIs has almost the same format to check that AsyncGetCallTrace returns the correct result at safe points. Both APIs should yield the same results there.
The check here is as simple as calling both APIs in the Trace::check method and comparing their results (omitting the location info as this is less stable). This has, of course, the same caveats as in the previous layer, but this is acceptable, in my opinion.
If you're curious: The main difference between the frames of both APIs is the magic number that ASGCT and GST use to denote native methods in the location field.
Async AsyncGetCallTrace layer
We aim to convince ourselves that AsyncGetCallTrace is safe at non-safepoints, assuming that AsyncGetCallTrace is safe at safe points (here the beginning of methods). The solution consists of two parts: The trace stack, which contains the current stack trace and the sample loop, which calls AsyncGetCallTrace asynchronously and compares the returns with the trace stack.
The trace stack data structure allows the pushing and popping of stack traces on method entry and exit. It consists of a large frames array that contains the current frames: the index 0 has the bottom frame, and the index top contains the top most frame (the reverse order compared to AsyncGetCallTrace).
The array is large enough, here 1024 entries, to store stack traces of all relevant sizes. It is augmented by a previous array that contains the index of the top frame of the most recent transitive caller frame of the current top frame.
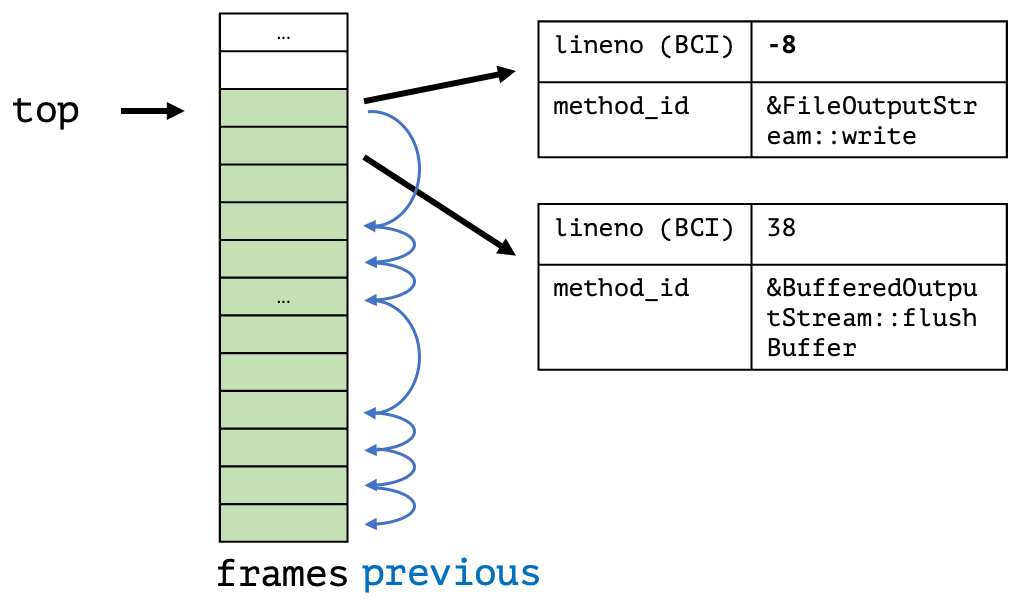
We assume here that the caller trace is a sub-trace of the current trace, with only the caller frame differing in the location (lineno here). This is due to the caller frame location being the beginning of the method where we obtained the trace. The calls to other methods have different locations. Therefore, we mark the top frame location with a magic number to state that this information changes during the execution of the method.
This allows us to store the stack of stack traces compactly. We create such a data structure per thread in thread local storage. This allows us to obtain a possibly complete sub-trace at every point of the execution, with only the top frame location of the sub-trace differing. We can use this to check the correctness of AsyncGetCallTrace at arbitrary points in time:
We create a loop in a separate thread that sends a signal to a randomly chosen running Java thread and use the signal handler to call AsyncGetCallTrace for the Java thread and to obtain a copy of the current trace stack. We then check that the result is as expected. Be aware of the synchronization.
With this, we can be reasonably sure that AsyncGetCallTrace is correct enough when all layer tests run successfully on a representative benchmark like renaissance. A prototypical implementation of all of this is my trace_validation project: It runs with the current head of the OpenJDK without any problems, except for an error rate of 0.003% percent for the last check (depending on the settings, but also with two caveats: the last check still has the problem of sometimes hanging, but I'll hope to fix it in the next few weeks, and I only tested it on Linux x86.
There is another possible way to implement the last check, which I didn't implement (yet) but which is still interesting to explore:
A variant of the Async AsyncGetCallTrace check
We can base this layer on top of the GetStackTrace layer too by exploiting the fact that GetStackTrace blocks at non-safepoints until a safe point is reached and then obtain the stack trace (see JBS). Like with the other check variant, we create a sample loop in a separate thread, pick a random Java thread, send it a signal, and then call AsyncGetCallTrace in the signal handler.
But directly after sending the signal, we call GetStackTrace, to obtain a stack trace at the next safe point. The stack trace should be roughly the same as the AsyncGetCallTrace trace, as the time delay between their calls is minimal. We can compare both traces and thereby make an approximate check.
The advantage is that we don't do any instrumentation with this approach and only record the stack traces that we really need. The main disadvantage is that it is more approximate as the timing of AsyncGetCallTrace and GetStackTrace is not apparent and indeed implementation and load specific.
I did not yet test it but might do so in the future because the setup should be simple enough to add it to the OpenJDK as a test case.
Conclusion
I've shown you in this article how we can test the correctness of AsyncGetCallTrace automatically using a multi-level oracle.
The implementation differs slightly and is more complicated than expected because of the peculiarities of writing an instrumentation agent with a native agent and a native library.
I'm now pretty sure that AsyncGetCallTrace is correct enough, and I hope you're too. Please try out the underlying project and come forward with any issues or suggestions.
This article is part of my work in the SapMachine team at SAP, making profiling easier for everyone. This article first appeared on my personal blog mostlynerdless.de.
- March 16, 2023
- 7 min read




Comments (0)
No comments yet. Be the first.