Breaking the Code: How Chris Newland is Changing the Game in JVM Performance!
- June 12, 2023
- 9 min read

We're excited to introduce you to Chris Newland, an industry veteran and dedicated JVM performance specialist.
Chris has a long-standing history of contributing to the Java community with open-source tools aimed at enhancing Java and JVM understanding.
Among his well-known tools is JITWatch, which has gained significant recognition and use in the JVM community.
In this conversation, we delve into Chris's journey, his motivations, and his thoughts on JVM performance, Java ecosystem changes, and the role of AI in software development.
Profile:
- 🌐 Home page: https://www.chrisnewland.com/
- 🐦 Twitter: https://twitter.com/chriswhocodes
- 🐘 Mastodon: @[email protected]
- 💼 LinkedIn: https://www.linkedin.com/in/chriswhocodes/
- 📂 Github: https://github.com/chriswhocodes
Bazlur: Can you tell us about your background and your journey to becoming a JVM performance specialist? What motivated you to focus on this specific area of computing?
Chris: My Java journey began in 1999, in my first job after university. I joined Nortel Networks as a junior software engineer in their “Intelligent Agents” R&D group, investigating the use of mobile code (running code that can migrate between execution environments) in the telecommunications domain.
In 2004 I started working in the financial markets, and software performance became an aspect of my work but my interest in JVM deep dives really took off in 2013 when I received an invitation to attend the JCrete conference (https://jcrete.org).
I was fascinated by how the Just-in-Time (JIT) compilation system optimizes your Java program at runtime. After spending many hours poking around in LogCompilation XML files, I had the idea to create a tool to understand the JVM’s JIT decisions better.
I decided it was time to level up my knowledge of the JVM and bought a copy of “The Well-Grounded Java Developer” by Ben Evans and Martijn Verburg. I was fascinated by how the Just-in-Time (JIT) compilation system optimizes your Java program at runtime. After spending many hours poking around in LogCompilation XML files, I had the idea to create a tool to understand the JVM’s JIT decisions better. That tool became JITWatch, which was the start of my journey into building open-source JVM tools and writing about the JVM in books and articles.
Bazlur: Your tool, JITWatch, has gained a lot of recognition in the JVM community. Can you give us a brief overview of JITWatch? What problem did you see that it could solve?
Chris: The HotSpot JVM can output information about JIT optimization decisions in several ways:
- PrintCompilation gives basic information about compilations and inlining.
- LogCompilation produces a verbose XML format that also describes branch prediction, escape analysis, intrinsics, lock elision, code cache layout and more.
- PrintAssembly uses a disassembly plugin to output the actual platform-specific native code generated by the JIT compiler when it optimizes a Java method.
None of these log files are particularly easy to read for non-trivial programs, so I built a visualizer called JITWatch.
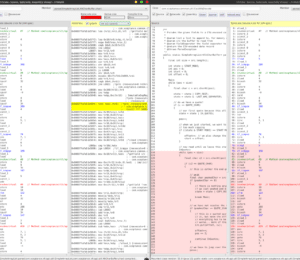
JITWatch understands the LogCompilation and PrintAssembly file formats and parses them to produce a user-friendly representation of what happened to your program as it is executed on the JVM.
JITWatch understands the LogCompilation and PrintAssembly file formats and parses them to produce a user-friendly representation of what happened to your program as it is executed on the JVM. It uses graphs, tables, toplists, histograms, and other visual aids to make the story more easily understandable.
JITWatch is now ten years old and is still being cloned over 1,000 times per month at GitHub. I’ve heard that it’s still used by the JVM team inside Oracle.
Bazlur: Can you give us a brief overview of the suite of tools you've created, including JaCoLine, VMOptionsExplorer, and Byte-Me? How have these tools and projects evolved over time, and what future developments do you have in mind for them?
Chris: I like to keep up with the OpenJDK mailing lists and find it really interesting to follow the discussions that lead to both new Java language features and new developments in the JVM, such as new GC algorithms and the continuous optimization of the VM code.
I like to keep up with the OpenJDK mailing lists and find it really interesting to follow the discussions that lead to both new Java language features and new developments in the JVM.
Reading these lists, I noticed the addition and removal of JVM command line options and realized there was no single, up-to-date dictionary of this information.
That gave me the idea for VMOptionsExplorer, which is a tool that tracks and processes the OpenJDK sources for every Java version and builds an interactive, searchable web page of every JVM option. VMOptionsExplorer currently lives at https://chriswhocodes.com, but I’m working with the Foojay team to move the tool to live on foojay.io, where it can reach a wider audience.
After VMOptionsExplorer, I had the idea to use these JVM options dictionaries to produce a tool for validating Java command lines and to help with Java version upgrades by giving warnings about whether a command line will still work on later Java versions and whether any default values have changed. That tool is called JaCoLine (for Java Command Line) and currently lives at https://jacoline.dev
Byte-Me is my next Java tooling project. I’m putting the finishing touches on it and hope to demo it at this year’s JCrete conference! I won’t spoil the surprise but think of it like javap with rocket boosters 🙂
Bazlur: As a seasoned professional in JVM performance, what advice would you give to someone aspiring to build a career in this area? What foundational knowledge should they have, what resources can they use to learn, and what kind of experience should they seek to gain? Are there any particular challenges or opportunities in this field that they should be aware of?
Chris: The JVM is an amazing piece of technology that can do a good job of executing almost any workload. It has the ability to inspect its execution environment and make sensible decisions about how best to operate. For a lot of workloads, “tuning” the JVM via command line switches won’t be necessary beyond sizing the memory heap to your stable working set, and you should be careful about copy-pasting JVM options you’ve found online without fully understanding them.
If you want to specialize in Java performance, then learn how the full execution stack works and understand what and how to measure. Accept that your intuition for improvements will often be wrong.
If you want to specialize in Java performance, then I have two pieces of advice:
- Learn how the full execution stack works. Understand that the beautiful high-level Java you are writing is compiled into a simple, portable, stack-based instruction set called bytecode which begins execution in an interpreter and relies on the JVM profiling and selectively JIT-optimising methods and loops into native code to improve performance.
- Learn how and what to measure. Refresh your knowledge of the key concepts of statistics. Download Java Microbenchmark Harness (JMH), run the samples and try to understand what they are teaching.
- Accept that your intuition for improvements will often be wrong! There is a lot happening between your source code and what is executing on the CPU, so use the tools available to try and understand it.
Bazlur: You've developed a number of open-source JVM tools that have been widely used and contributed to. For individuals interested in joining and contributing to these projects, could you provide a brief guide on how they can get started?
Chris: Please talk to me first 🙂 Drop me an email at [email protected] with your idea before submitting a PR because I might already be working on something similar or taking the tools in a different direction.
Bazlur: Java has evolved significantly over the years, with new features and functionalities being introduced in each release. Out of these numerous updates, is there a specific feature that you find particularly exciting or innovative? Can you share why this feature stands out to you?
Chris: Personally, I’m more interested in progress in the JVM than the Java language itself.
At the language level, I’ve appreciated generics, lambdas, and streams, and I am interested in Project Loom, but none of these are as important to me as the advances made in GC algorithms and the continual improvements to the JVM and JIT subsystem.
These are the changes that bring free performance boosts to the same code you wrote and compiled months or years ago.
Bazlur: With AI becoming more prevalent in various sectors, including software development, how do you see developers adapting to this change? As a JVM performance specialist, do you see the possibility of AI replacing or augmenting the work you do in JVM optimization? Are there any aspects of JVM performance tuning that AI cannot handle well? What are these areas, and why do you think they are resistant to automation?
Chris: “AI” is an umbrella term for some interesting algorithms. The application of conversational interfaces to Large Language Models has sent the hype train into overdrive and made a lot of people lose sight of what’s actually happening: the system is producing statistically plausible output based on its training data with no ability to determine its correctness.
The Java language and JVM have been designed hand in hand so that readable, idiomatic source code leads to good runtime performance through Profile Guided Optimization. I don’t currently see “AI” as beneficial to the Java performance ecosystem.
The Java language and JVM have been designed hand in hand so that readable, idiomatic source code leads to good runtime performance through Profile Guided Optimization. I don’t currently see “AI” as beneficial to the Java performance ecosystem.
Bazlur: Let's shift gears and talk about the current state of software development. In your opinion, what are some of the biggest challenges that developers face today? Additionally, do you have any advice on how to overcome these challenges?
Chris: Most of the problems I see exist outside the Java world. Broken backwards compatibility, uncontrolled feature addition, issues with build and dependency management systems, lacklustre IDEs and tooling.
The steady progress of the Java ecosystem through the OpenJDK project, Java Community Process, JEPs, and the combination of efforts from the language steward Oracle and other industry participants makes for a stable environment where developers can safely invest their careers.
Bazlur: Would you be willing to share some of your memorable experiences from your time in the software industry with us? We would love to hear your stories.
Chris: One of my favourites was an issue someone raised on JITWatch, where they reported that the PrintAssembly native code for a Java method was missing. After some investigation, it turned out that the method in question (a series of mathematical operations on its inputs) was being tested with parameters such that the HotSpot C2 JIT compiler was able to reduce the entire method down to mov $0xe, eax (return 14).
Bazlur: That's fascinating! Speaking of JIT optimizations, could you tell us how these optimizations actually work? And what are some of the most common optimizations that the JIT compiler performs?
Chris: You can learn all about how the JVM achieves excellent runtime performance in the book Optimizing Java (https://optimizingjava.com) by Ben Evans, James Gough, and Chris Newland but in a nutshell, the JVM builds a profile of the running bytecode and looks for frequently executed "hot spots" (hence the name of the HotSpot JVM) by counting method invocations and loop back-edges. When these counters cross a threshold, the method (or loop) is queued for compilation.
The JIT compilers (HotSpot contains two compilers; one simple, one advanced) take methods from the compilation queue and, using the collected profile, transform the bytecode into optimized native code. HotSpot JIT optimizations include method call devirtualisation, method inlining, dead code elimination, common subexpression elimination, branch prediction, lock coarsening and lock elision, escape analysis and many more. The native code is stored in a special memory region of the JVM called the code cache, and further calls to the method will execute the optimized native code and not the interpreted bytecode.
The JIT is able to make speculative optimizations (assuming the behaviour it has observed will continue to be true) by inserting checks into the native code called "uncommon traps". If a trap is triggered, the speculative assumption is invalidated and the JVM can "deoptimize" and revert to executing the interpreted bytecode, where it will begin building a new profile to allow it to try and optimize again later.
Bazlur: Thank you so much for sharing your insights with us. We appreciate your time. Before we end, is there any parting advice or resources you would like to share with our readers, such as a list of recommended books or any other helpful information?
Chris: I recommend that anyone looking to understand the history and future development of the Java language should read the JDK Enhancement Proposals (JEPs). They are written to a template that captures all of the key information and offers great insight into the careful consideration applied to each change in the language. I have created some tools on top of the JEPs which allow for easier searching at https://chriswhocodes.com/jepsearch.html
Conclusion
In this insightful conversation, Chris Newland shed light on a variety of topics, ranging from his journey as a JVM performance specialist to the intriguing tools he's developed, such as JITWatch, VMOptionsExplorer, and Byte-Me.
He also shared his viewpoints on the evolution of Java, the role of AI in software development, and the current state of the industry.
The knowledge and experiences he shared will no doubt be invaluable for developers and JVM enthusiasts.
We thank Chris for his time and his generosity in sharing his knowledge with our readers.
His work continues to inspire and guide many in the JVM community, and we look forward to his future contributions.
I hope you, as a reader, have found this interview beneficial. Stay tuned for next week's interview with another industry star.
Note: This comprehensive and insightful interview was conducted through various digital platforms, including Google Docs, email, and Slack. We welcome any suggestions to enhance our process, ensuring better future experiences.
- June 12, 2023
- 9 min read


Comments (1)
Jacobjob
3 years agoThanks guys, for this interesting interview. I already bought the Optimizing Java book, to learn a lot more about this topic.