Debugging RAM: Detect/Fix Memory Leaks in Managed Languages – Heap Deep Dive (Part 2)
- February 10, 2022
- 9 min read
In the previous installment, I talked about the Java garbage collector. In this part, I'll discuss the most common memory issue: the memory leak. I focus on managed languages, specifically Java, but I will mention some native code tools which are interesting. A memory leak contributes to heap size, which isn't the most pressing bug in most cases. But when left alone, memory usage can become a problem and, by that point, finding the issue is hard. Unlike a crash dump, where we get a reference to a specific line, a memory leak can remain hidden.
What are the Consequences of Memory Leaks?
Unfortunately, this often means that memory leaks can carry into production and even cause problems to end users. E.g. This recent story about memory leaks hobbling Apples latest M1 computers. Virtual memory effectively means operating systems can carry memory leaks for a very long time. The performance overhead will be noticeable, though.
With the garbage collector, we often rely on the automatic memory management to solve such memory issues. But that's just not the case in real life. Typically, this problem is harder to solve for languages with manual memory management and those with reference counting. I'll specifically exclude Rust in this discussion. I don't have enough experience in it to say anything of value. It seems very interesting but has some complexities.
There are powerful tools for application memory profiling, but even they often show data as byte arrays. This doesn't bring us any closer to solving the issue. In this article, I'll walk you through debugging memory usage. I'm assuming that you already know there's a leak after reviewing memory usage. So the focus here is on narrowing it down.
Types of Heap RAM
One problem with tracking heap memory is managing expectations. You would expect that a memory allocation will cause an equivalent growth in memory and freeing the memory would restore things. This isn't always the case.
Most memory leaks happen in the heap, but there are rare cases where the source of the leak can be in native code, PermGen space, etc. We should debug native issues using native memory tools. We can tune other types of memory via JVM flags. You can often detect the source of the memory leak by looking at the out of memory error message. The following types are common:
- PermGen space - this was common in older JVMs, especially with tools that do heavy bytecode manipulation. It isn't as common today thanks to dynamic PermGen space
- Java heap space/Requested array size exceeds VM limit/Out of swap space? etc - this probably means the leak is in your code or in a 3rd party library. But it's in Java code which is good news!
- If the stack points at a native method - this could relate to a native method leak
Notice that this isn't accurate, since a leak in native memory can deplete the Java heap and vice versa. We'll need to check both, but it will give us a sense of where to start...
Your Tool Box
There are MANY profiling tools for tracking/fixing memory leaks. It's impossible to give a proper review for even a small segment of the available richness. I won't go even into a fraction of what's available. Instead, I'll focus on two tools: VisualVM and Chrome DevTools (with a focus on Node).
VisualVM lets us review the running application to get a snapshot of memory usage. Chrome DevTools is a more general purpose debugger that includes the kitchen sink for JavaScript developers. It can connect to the running node application and debug them.
I won't be discussing:
- Java Flight Recorder (JFR) and Mission Control - These tools are effectively the replacement tools for VisualVM. But they aren't as convenient. Yes, they can detect frequent garbage collection etc. but they aren't as ideal for fine grained debugging. Flight recorder also has problematic licensing issues. If you would like to use that instead, check out this article by Ashish Choudhary.
- Yourkit Profiler, Eclipse MAT, NetBeans Profiler, Parasoft Insure++, etc. - Those are all great tools that can help a lot in digging deeper but they warrant a product review not a technical article
- LeakCanary - There are other mobile tools but again, I want to focus more on the generic backend
- Valgrind - This is an interesting native tool to debug memory leaks in Linux
- CRT Library - For visual studio Microsoft provides some great primitives
- Some static analysis tools such as SonarCloud, or FindBugs can detect leaks. This won't detect all leaks, but they can point at some problematic cases
VisualVM
You can get VisualVM here. Once installed, you can launch VisualVM and connect it to our running application to see the process.
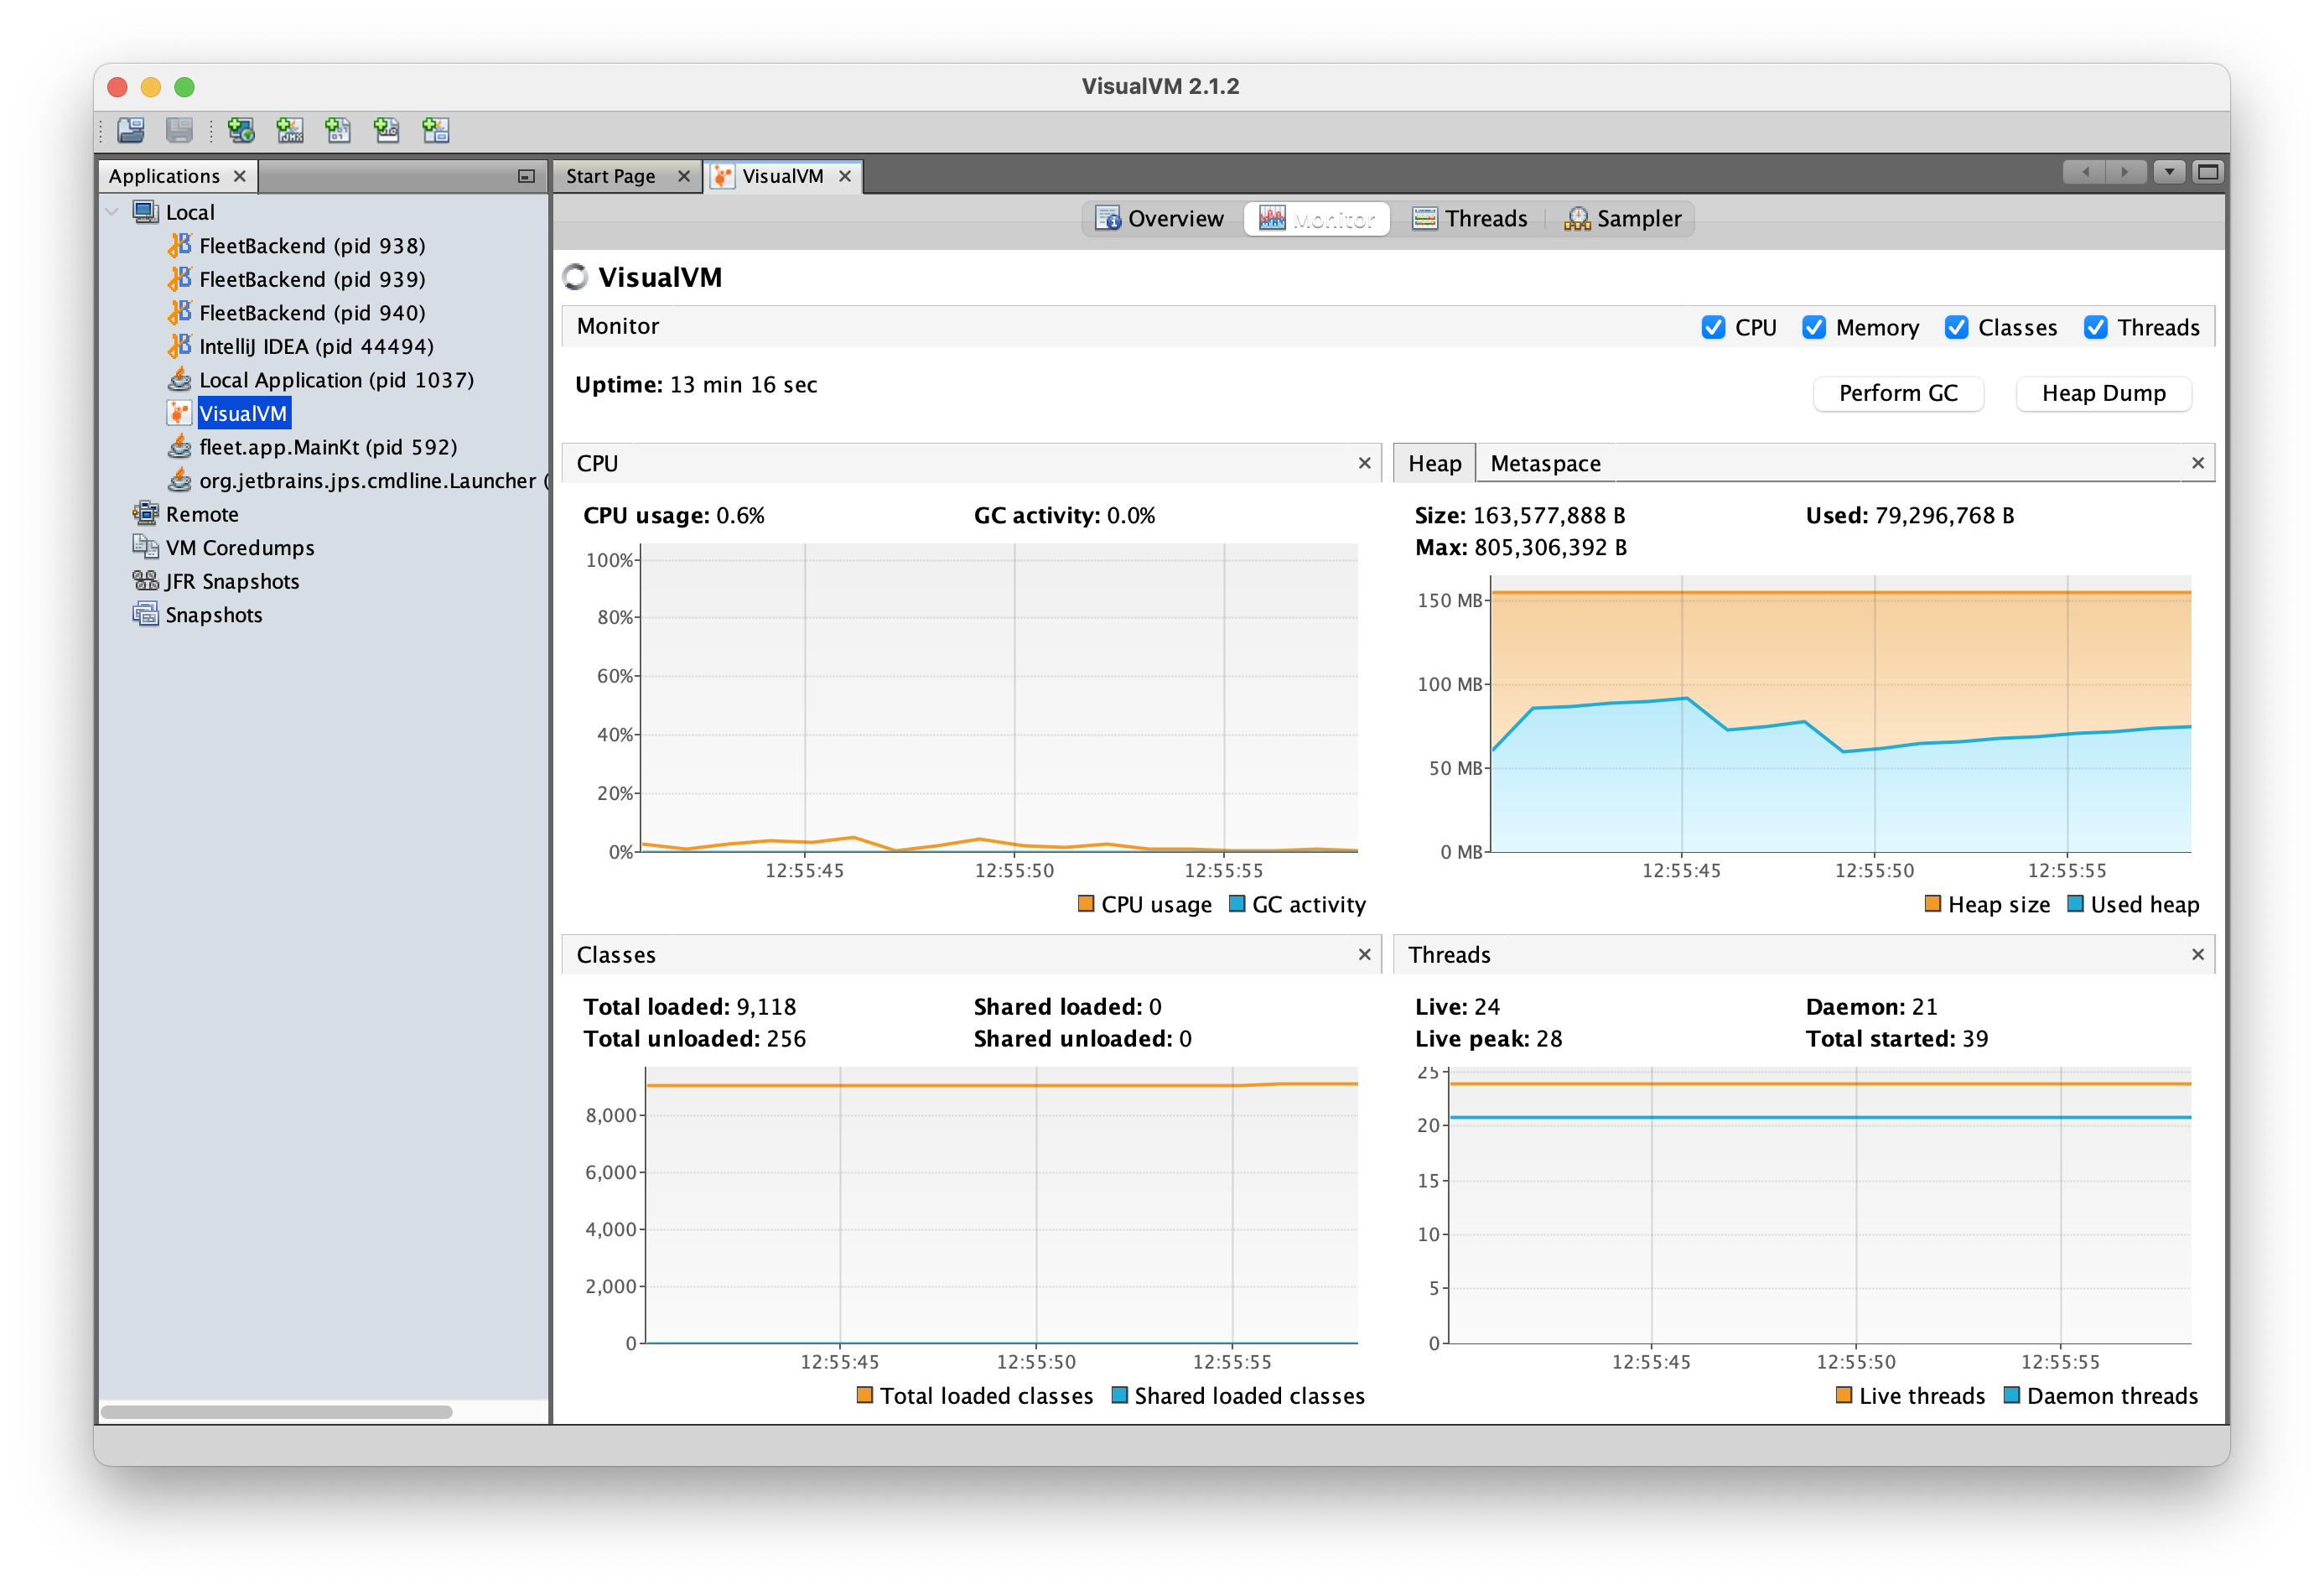
In the image above VisualVM is monitoring itself, that's pretty meta. You can perform manual garbage collection, which is very important to get a sense of the size of a leak. The heap graph provides you a bird's-eye view of the amount of memory over time and the trend.
Chrome DevTools
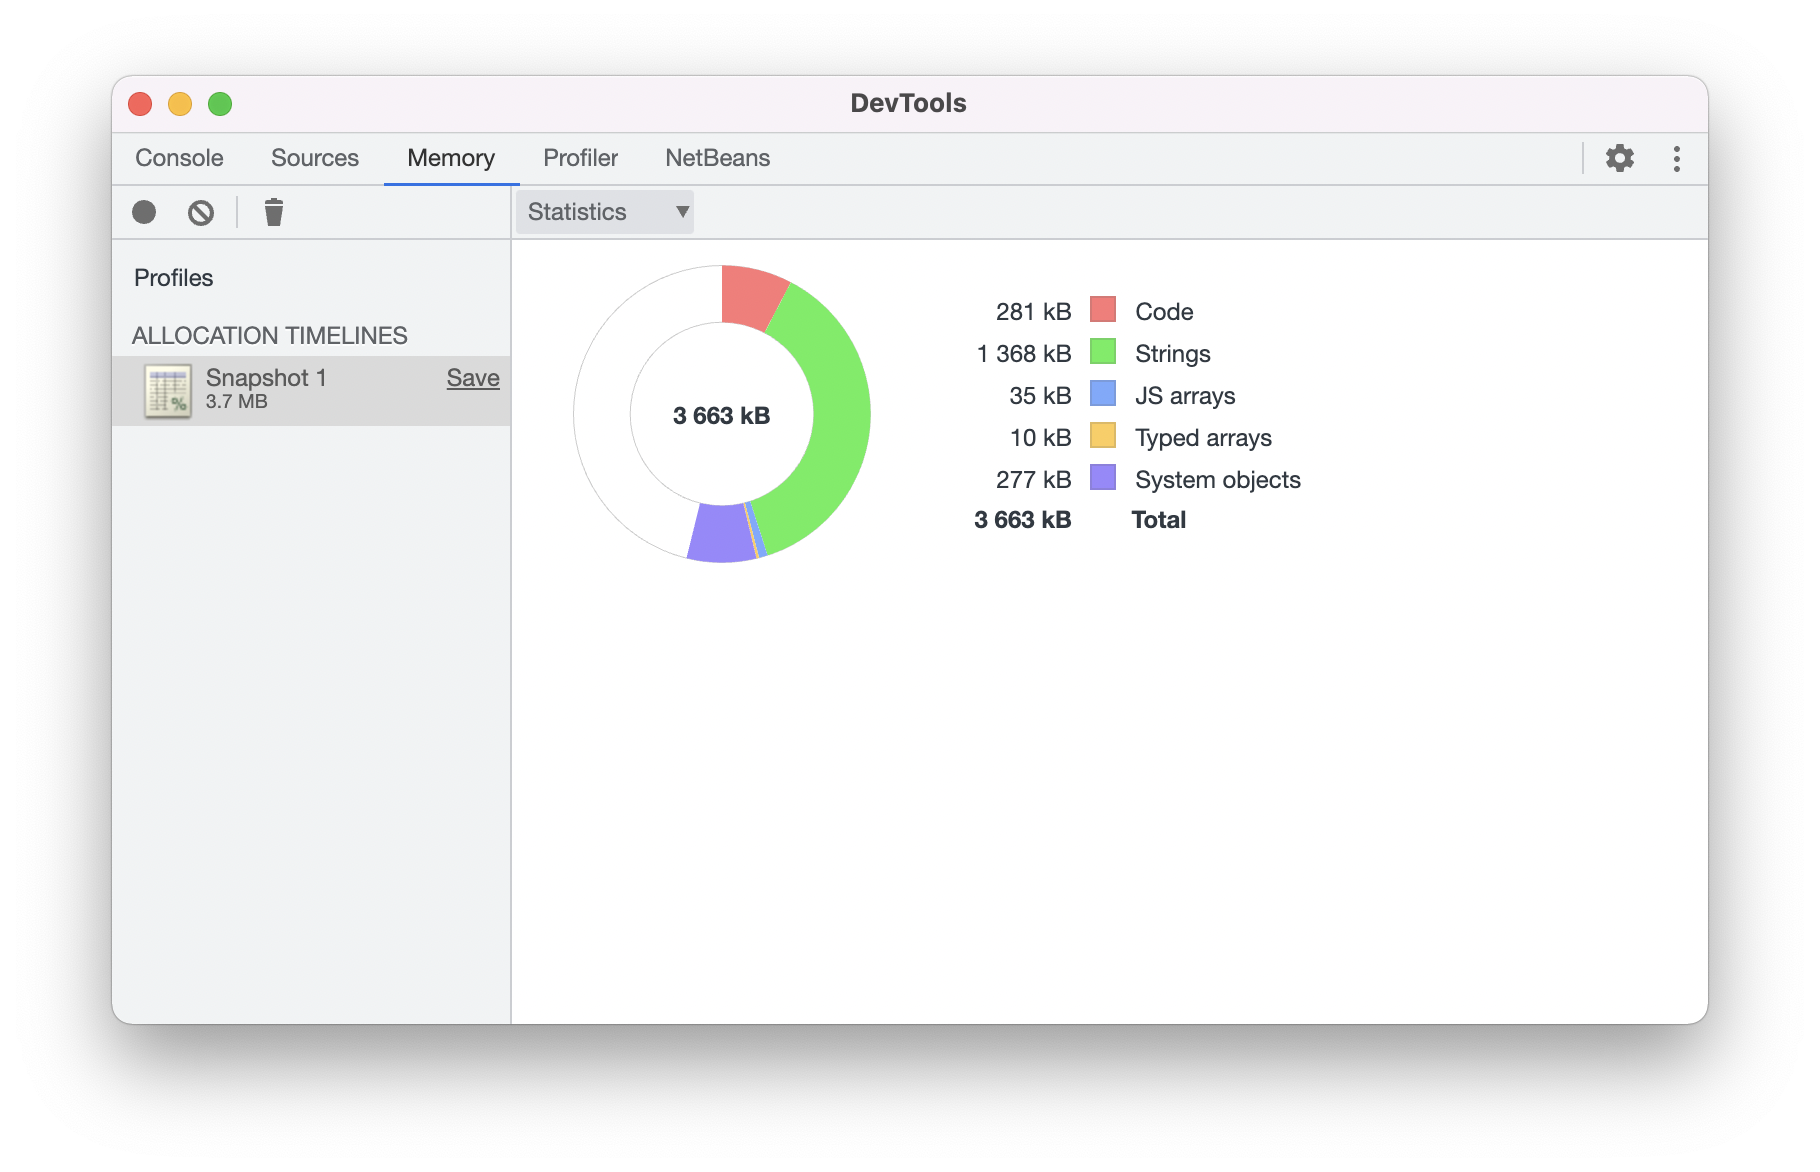
If you did front end work with Chrome, surely you ran into the "everything but the kitchen sink" debugging tools that are integrated into Chrome. Personally, I prefer the Firefox equivalents. They can connect pretty seamlessly to Node where they can provide many of the standard debugging capabilities, such as snapshots.
How to detect Leaks?
Leaks are pretty obvious when you see the memory grow and you don't see it shrinking back. But how can you pinpoint the source of the leak?
There are several strategies for this. In Java, you could in theory do an aggressive leak test like this:
void leakUnitTest() {
    performRiskyOperation();
    System.gc();
    Thread.sleep(1000);
    Runtime r = Runtime.getRuntime();
    long free = r.freeMemory();
    for(int iter = 0 ; iter < 100 ; iter++) {
        performRiskyOperation();
    }
    System.gc();
    Thread.sleep(1000);
    assertThat(Math.abs(r.freeMemory() - free) < validThreshold);
}
There are a lot of things going on here, so let's go over them individually:
- I run the risky operation once before starting - this is important. Static code and variable initializations take up RAM but aren't a leak
- I explicitly run System.gc(). This isn't an option in all languages and normally isn't recommended. But it “works”
- Even an explicit GC might have asynchronous elements, so a sleep is in order
- I run the test 100 times to make sure a small leak isn't adding up
- I have a threshold of valid values. Garbage collectors aren't perfect. We need to accept that some elements might take a while to get collected. The Java API has a lot of built-in static context (e.g. pools in primitive objects) that can cause minor unavoidable memory increases. This number shouldn't be too big though
Another important note is to use a simple garbage collector when running this test (a good practice altogether). I recommend reading my previous post on the subject.
The problem is the threshold. It effectively eliminates a lot of the benefit of the test, but unfortunately there's no way around it.
Let's look at a less "automated" way to detect leaks. Ideally, this is something that platforms will address more readily in the future.
We can detect leaks using VisualVM while we reproduce the issue. Press the garbage collector button and keep your eye on memory usage. This should bring you to a point where the graph slowly grows based on a specific action you take. Once you have that you can narrow it down to a method and a test case.
Is RAM Increasing Periodically?
What if RAM is just getting chewed up while you're literally doing nothing?
This is never the case. Something is happening in the background, and this background process causes the problem. That's actually an excellent thing. It means you can isolate this background process and debug only that.
Compare Snapshots to Find the Object type
The most important tool in our arsenal is the heap dump. In VisualVM, you can grab a dump by pressing the button on the top right side. It looks like this:
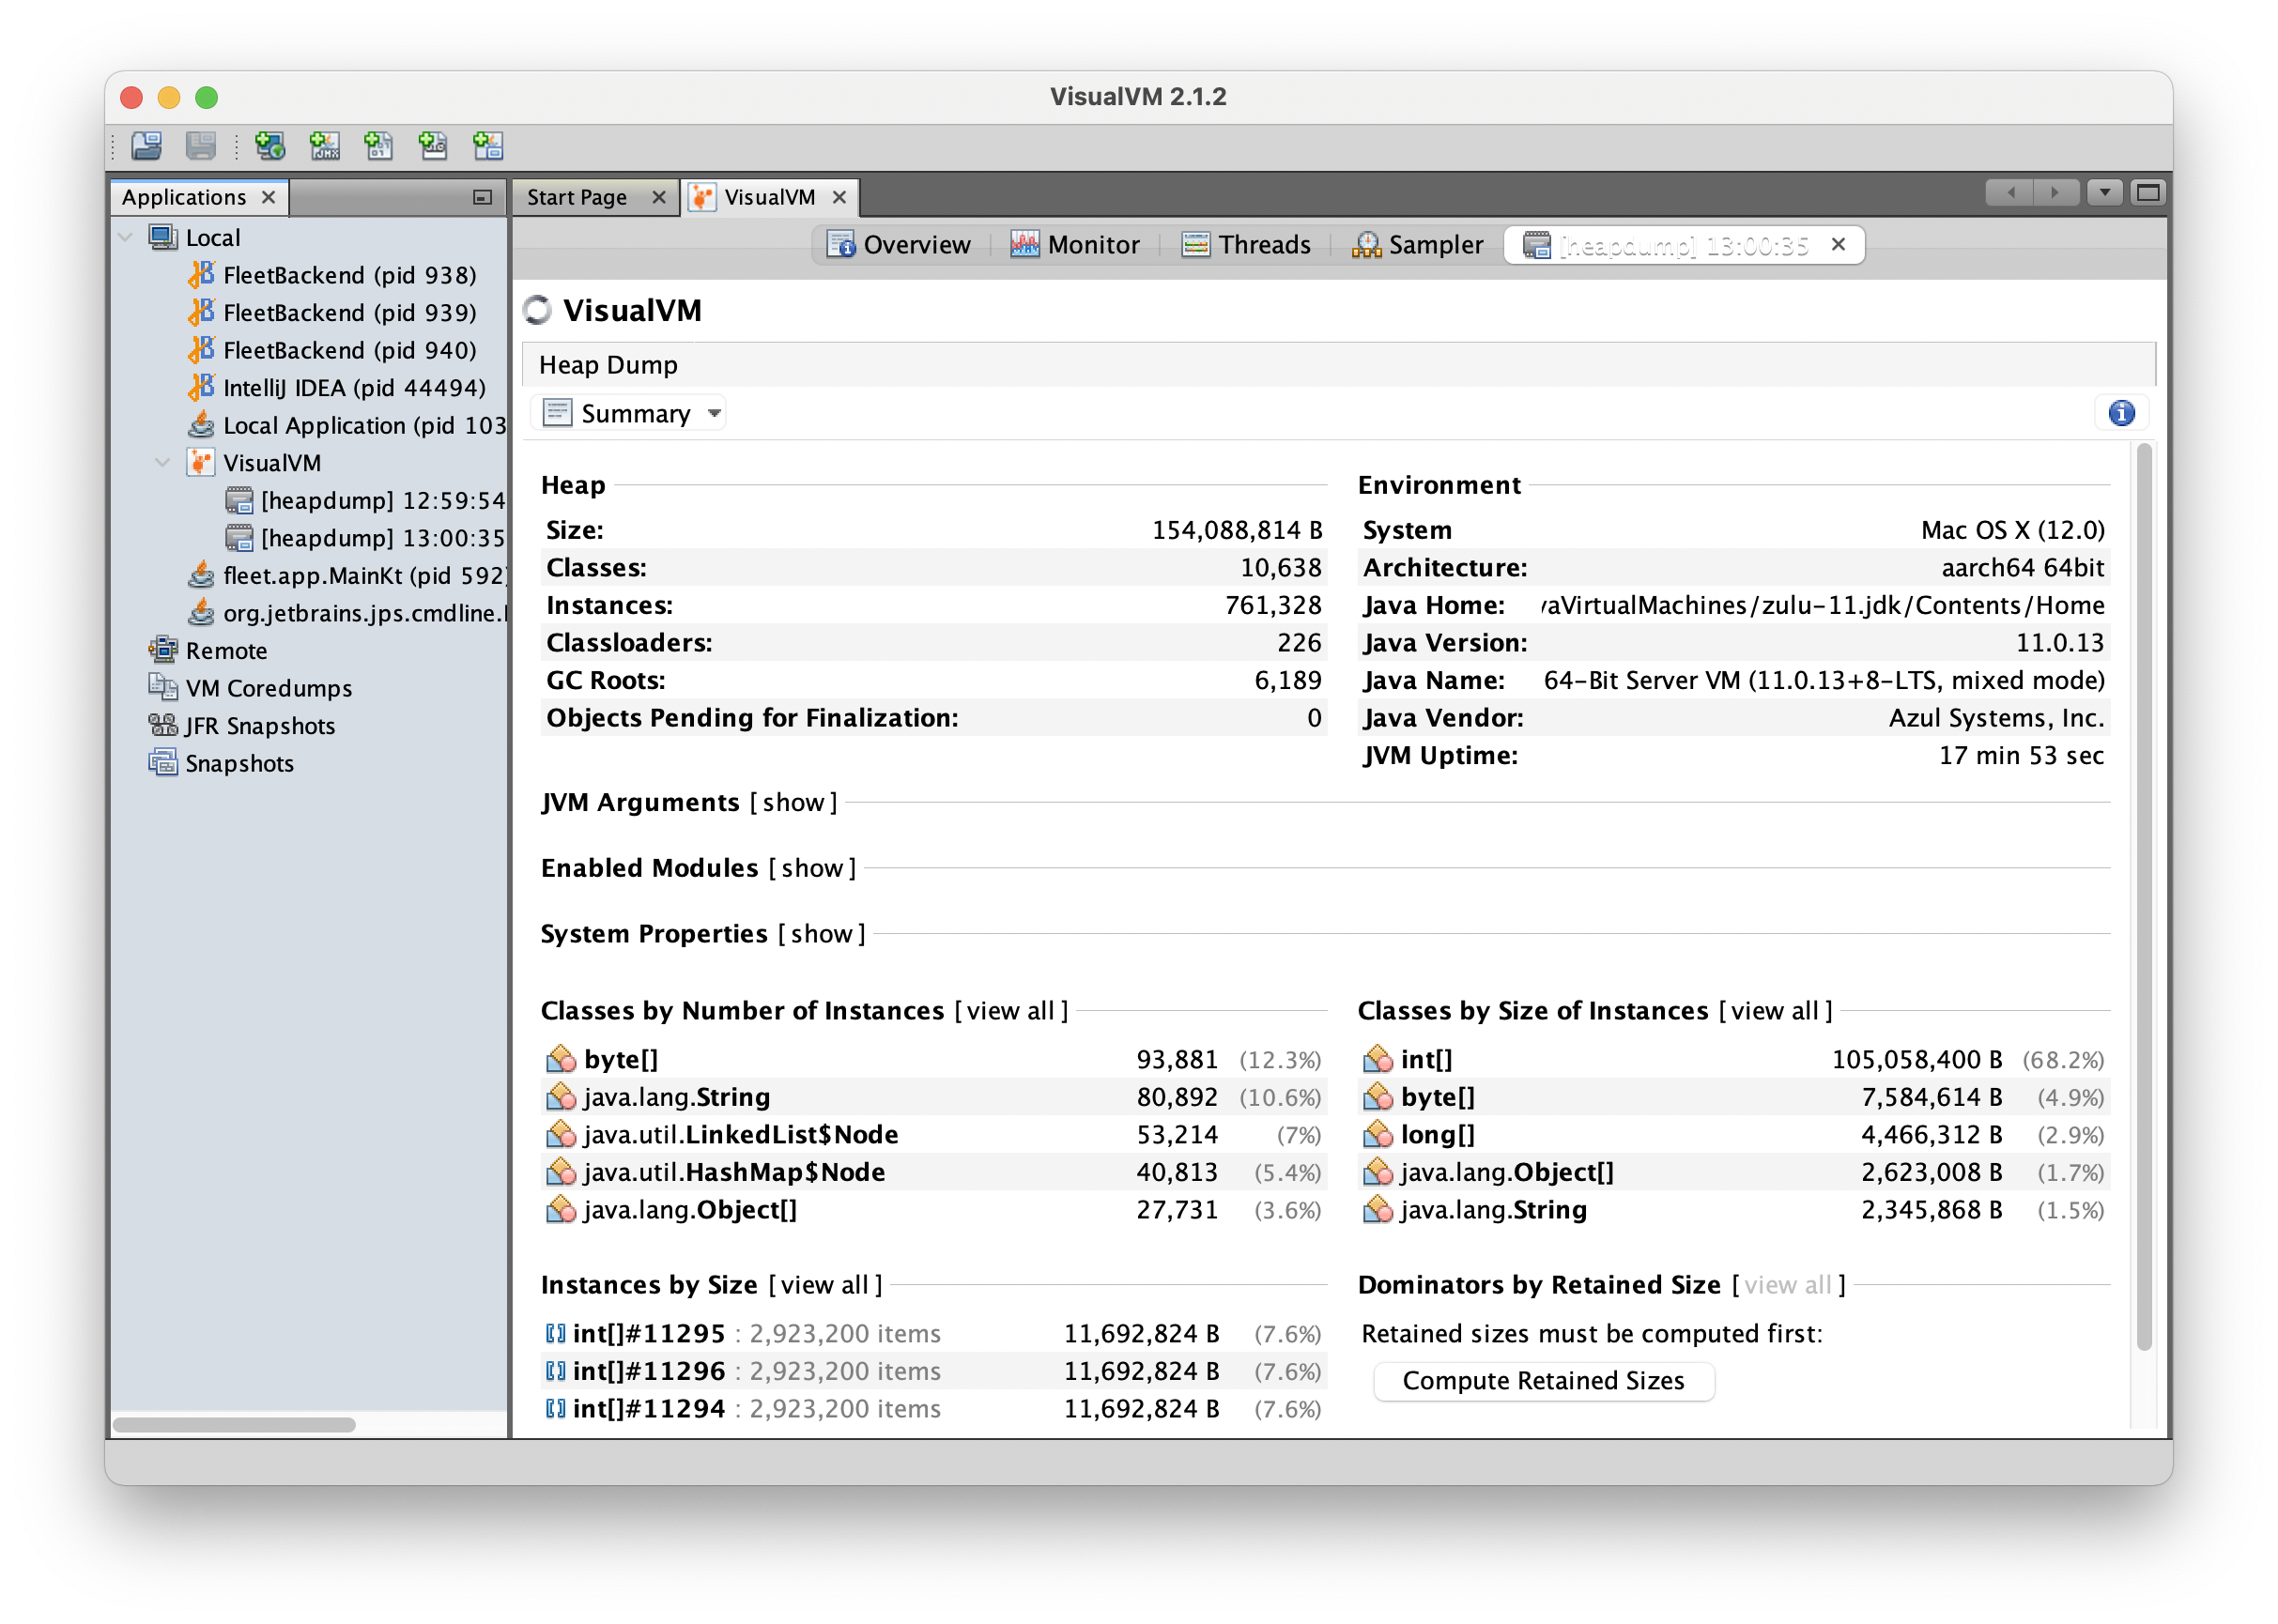
At the bottom you can see the classes sorted by number of instances, size of instances. This can help in narrowing a memory leak. Just grab two dumps. Then compare the RAM taken by a specific class to determine whether this class can be the one that leaked.
With Chrome DevTools, you can grab a snapshot using the main UI:
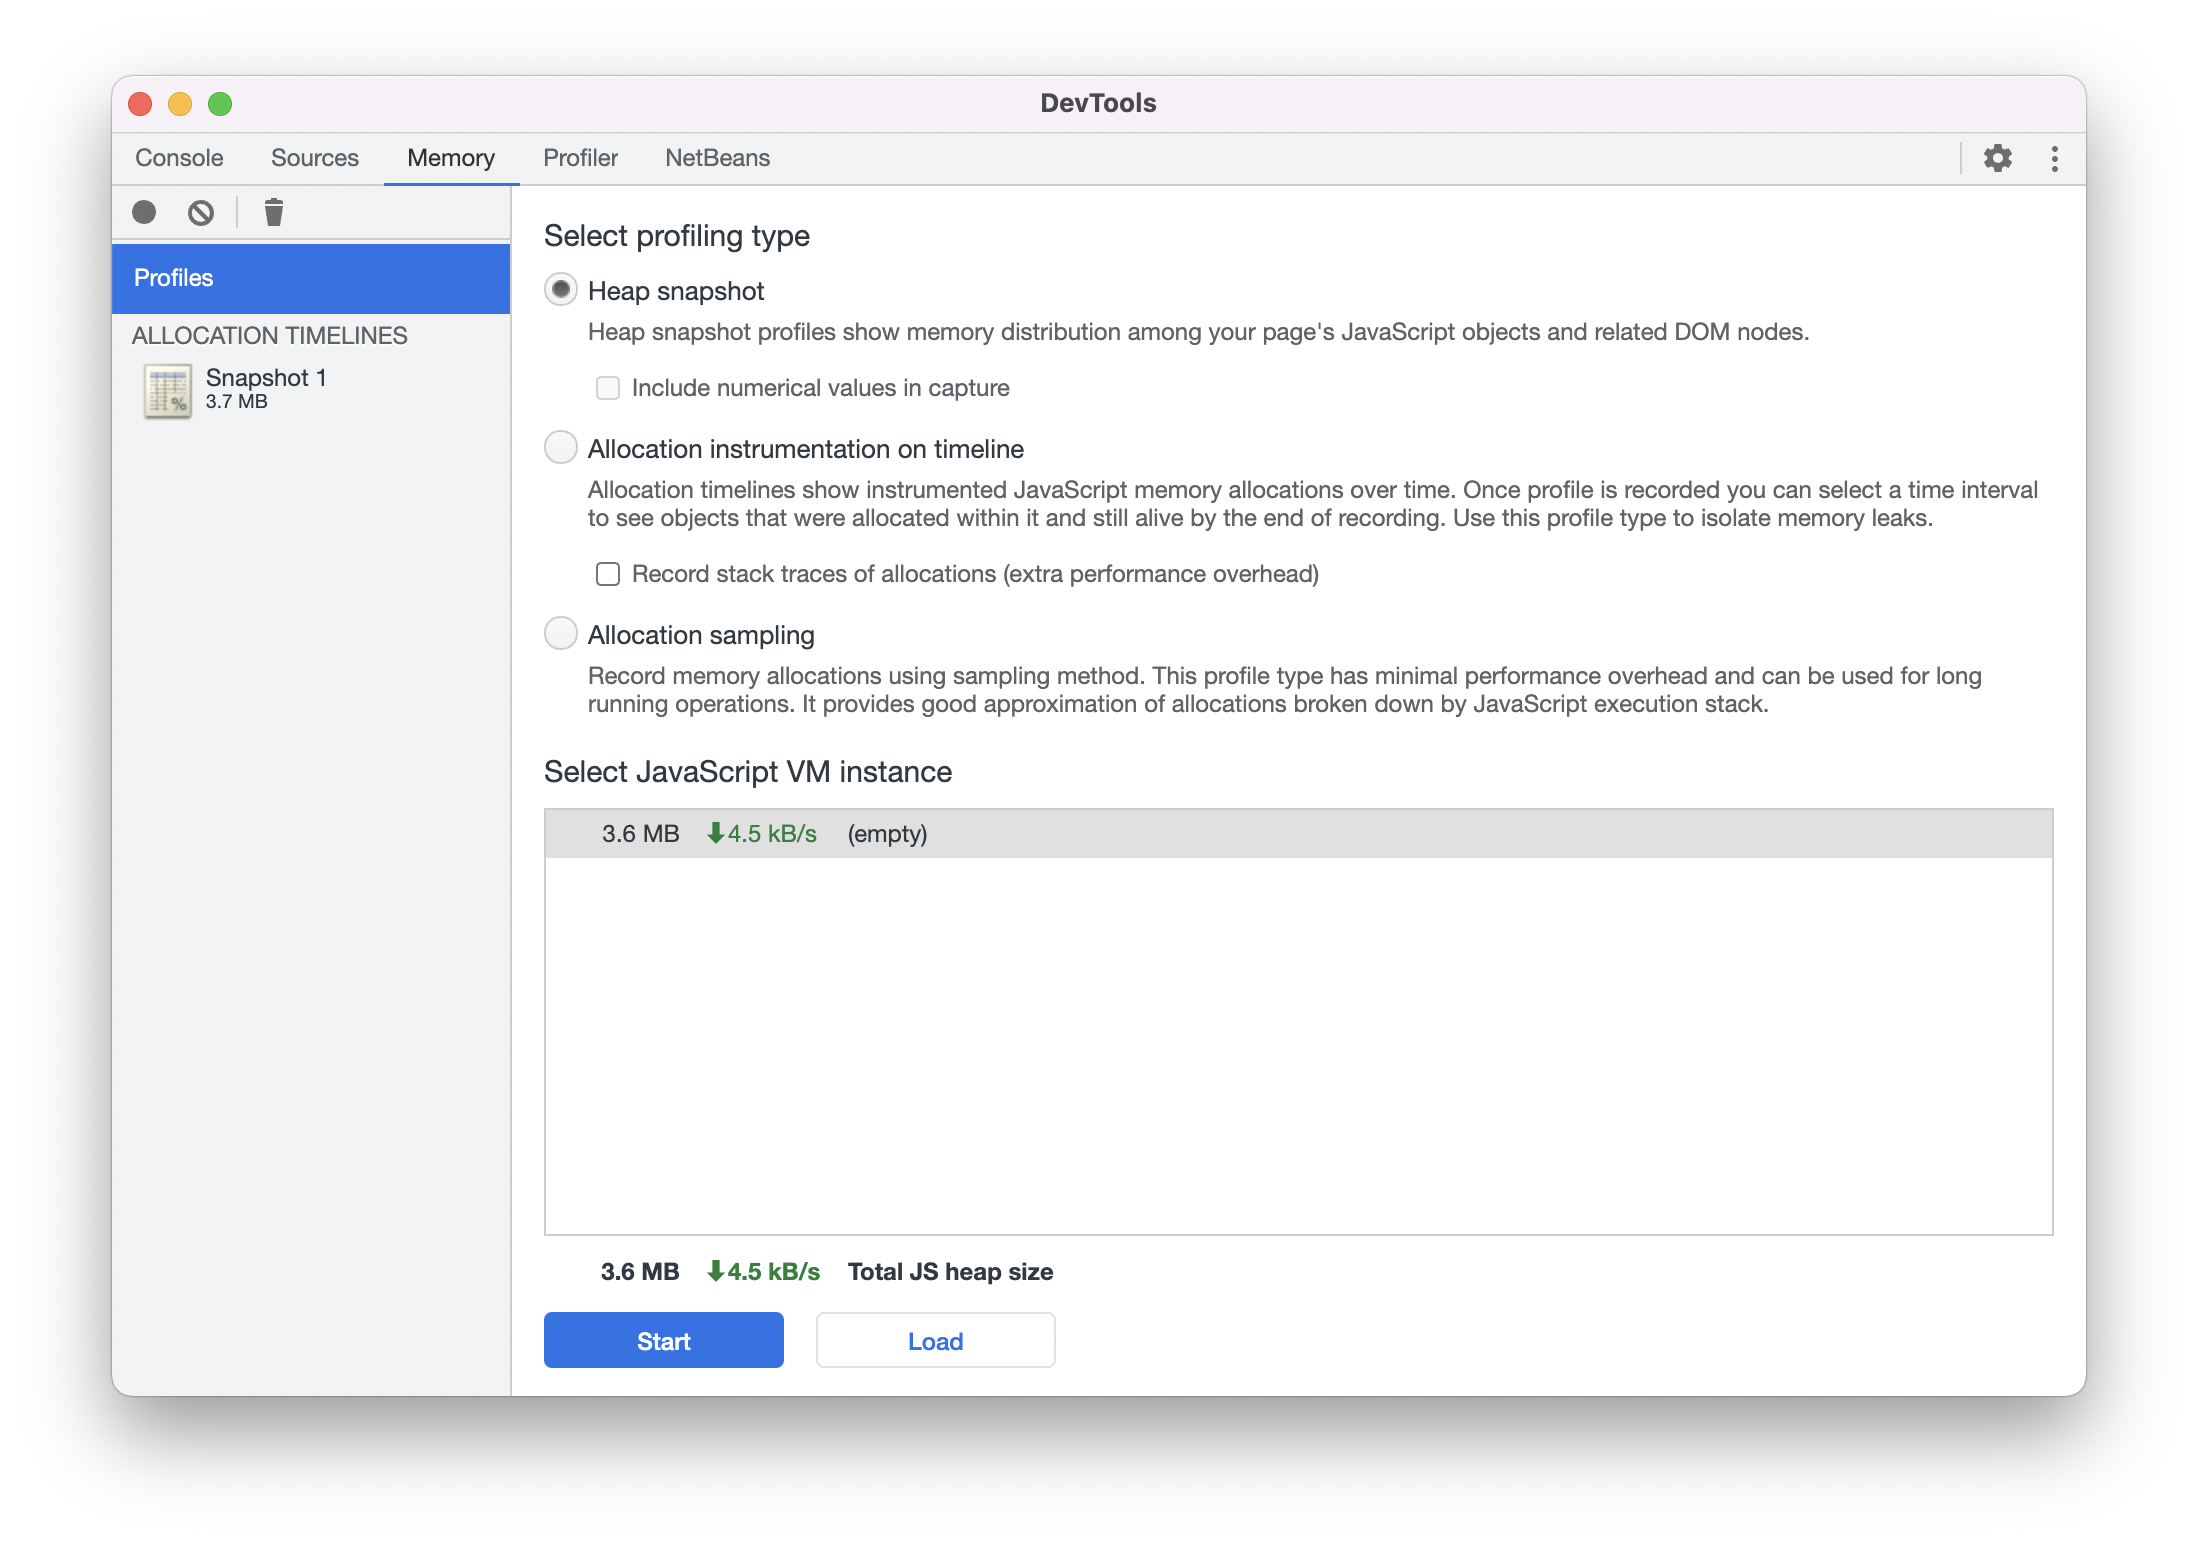
You can then use view, sort, and filter the resulting objects in the snapshots:
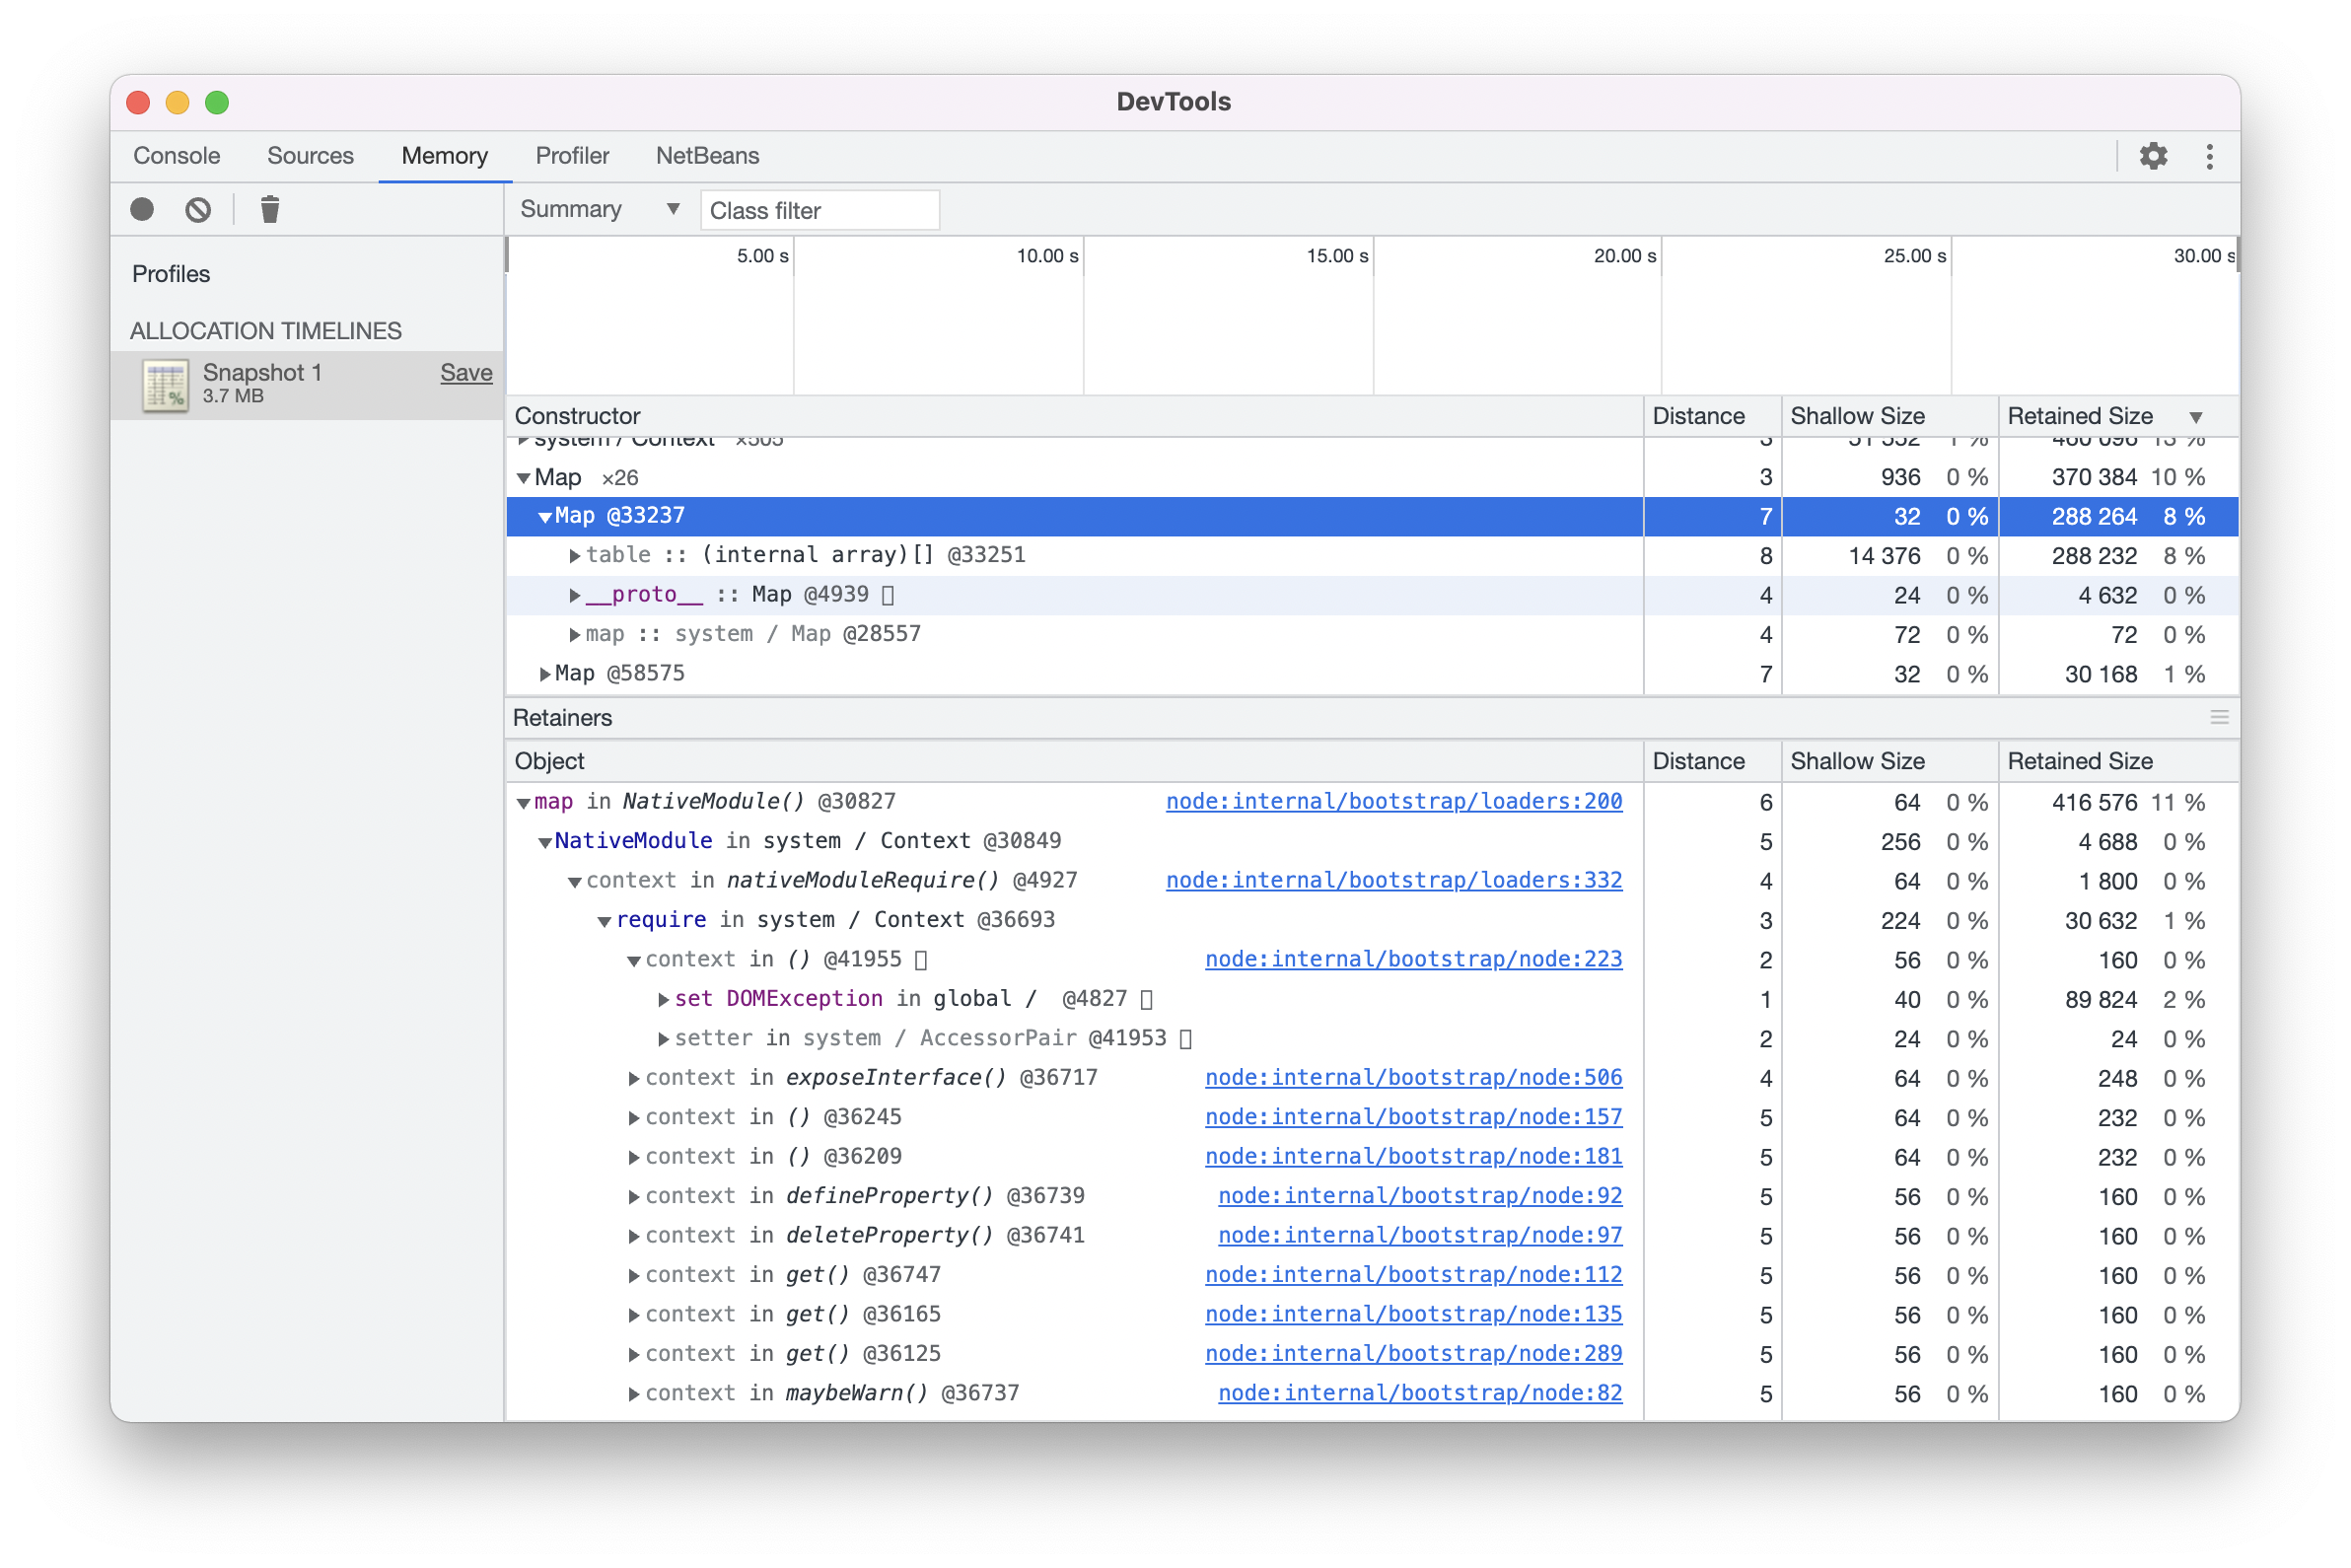
This is a very similar process to the one in VisualVM or pretty much any monitoring tool. You can narrow down the references and even see the stack matching a specific allocation in the code.
You can also make use of verbose GC (trace GC in NodeJS) to see details about the collected object. I often feel that this is a bit like drinking from a firehose. It's very hard to debug even a simple application with that output. But it can be useful if you're looking for something very specific.
Common Types of Memory Leaks
Leaks in managed platforms are effectively references to an element that is no longer necessary. There are many samples of this, but they all boil down to discarding said reference. The most common problem is caching. Creating an efficient caching solution without leaking is almost impossible.
Also, static context is always a risk, so you need to guard yourself against that and try to minimize it. Notice that singleton is still a static context...
Strings
Java strings are interned, which effectively means they can enter a global application scope. If you parse a lot of data, try to avoid strings to keep memory usage down and use streams/NIO instead.
Strings also take up a lot of space in NodeJS. Interning happens there too, but since strings and string objects are pretty different, the problem isn't as obvious.
Hidden Semantics
A good example here is Swing code like this:
new JTable(myModel);
Developers often discard the JTable object and keep the model. But because of the way MVC works in some UI frameworks (like Swing, Codename One etc.) a view registers itself as a listener to the model. This means that if you keep a reference to the model, the JTable can't be removed.
Since frameworks like this rely on hierarchy, this means all the elements in the Window containing the JTable can't be removed as well.
The solution for this is simple: Use debuggers!
Not just to debug code. But to inspect 3rd party objects. You need to familiarize yourself with the objects that are stored as part of these libraries.
Context Leak
I mentioned statics as an obvious source of a leak, but there are other places that trigger a similar function. ThreadLocal in Java effectively serves that purpose. Storing an object in a place such as session scope can lead to its retention well past its usefulness.
E.g. this pseudo-code might look harmless:
session.store(myUserData);
But if myUserData includes a reference to global data or other users, then we might leak those users with every new session.
Worse, this is a security vulnerability. A hacker can start opening sessions until our server crashes.
Whatever is stored in static, thread or any global context must always be a flat object or verifiably small object. This is a good practice for scalability, security, etc.
Resource Leak
When doing research for this article, pretty much every post mentioned leaking file resources, etc.
This is a separate problem. File resource leaks used to be a problem 20 years ago for some OSs. Current GC and cleanup make it so that those leaks almost don't matter.
However, database connections should be recycled to the pool and leaking them is indeed an issue. The problem is that those aren't exactly a leak like the other ones mentioned here. You will run into a different error, such as a problem connecting to the database since connection resources were exhausted. Despite having a lot of RAM. So I don't think this is the right article to discuss those.
How can we Prevent Leaks?
The most ideal situation is to never run into the problem. Obviously, having unit tests that check for RAM (with the reasonable stipulations above) is helpful. But as I mentioned above, they are flaky.
Always run unit tests while limiting the virtual machine RAM to verify that there's no significant leak. An out of heap crash during unit tests is a great indicator of a leak.
Write defensive code when building intricate APIs. IntelliJ/IDEA has some pretty complex code for binding IDE elements to plugins. This is a prime location for leaks and bugs. So the clever developers at JetBrains added logs in their code that detect such leaks on an unload. Take a page from their book, predict future problems... If you have an API that lets developers register, think about a way to detect leaks. Print out the list of remaining objects before the application is destroyed. It's possible those are leaks!
Pretty much everyone said this always, but try to get as much code to be stateless as you reasonably can. This will be good for scaling as well. Obviously, you shouldn't be afraid of session state. But you should be deeply familiar with every object that goes in the session.
Finally, run a memory monitor on your app. Review the objects, do they make sense?
Try to explain the logic of the objects you see in RAM. E.g. if your app has a lot of byte[] objects but doesn't use images or primitive data, there might be a leak.
TL;DR
Memory profilers are almost identical across platforms. We can look at the graph of memory growth and grab snapshots for the current memory state. We can then compare the snapshots to narrow down the general location of a leak.
We shouldn't wait for memory leaks to come up as production issues. We can use some simple strategies to avoid them in the first place:
- Create memory leak unit tests - although those are flaky
- Run tests within a limited RAM VM
- Write APIs that log remaining bound objects when exiting
- Write stateless code where possible and familiarize yourself with the exact stateful aspects of your code. Inspect the stateful objects in a debugger to make sure they don't reference global state
- Periodically review your apps RAM usage and try to make sense of the objects you see in front of you
Thanks for reading this far. Follow me on twitter for more.
- February 10, 2022
- 9 min read


Comments (0)
No comments yet. Be the first.