

Evolution of Java Memory Architecture (Pre Java 8.0)
- February 25, 2021
- 6 min read
- [Young Generation/Nursery] Eden Space
- [Young Generation/Nursery] Survivor 1 (From)
- [Young Generation/Nursery] Suvrivor 2 (To)
- [Old Generation] Tenured
- [Permanent Generation] Permgen space
[About SKP's Core Java/Java EE Roots]
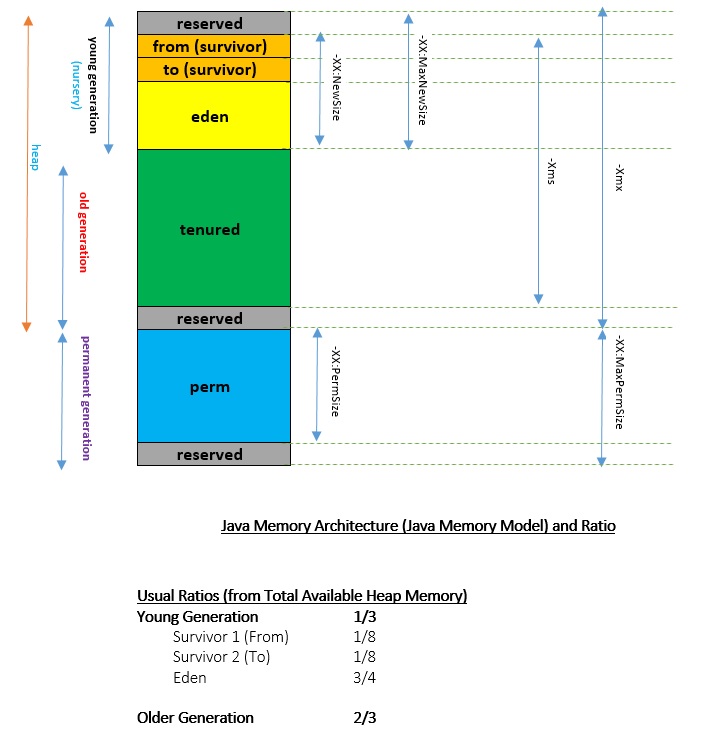
→ Java Memory Architecture (Java Memory Model)
→ Managed Area of the Java Memory Model
[Young Generation/Nursery] Eden Space
[Young Generation/Nursery] Survivor 1 (From)
[Young Generation/Nursery] Suvrivor 2 (To)
[Old Generation] Tenured
There are other important flags like, **-XX:InitialTenuringThreshold, -XX:MaxTenuringThreshold** and **-XX:TargetSurvivorRatio** which lead to an optimum utilization of the tenured as well as the survivor spaces.
By setting **-XX:InitialTenuringThreshold** and **-XX:MaxTenuringThreshold** we allow an initial value and a maximum value for 'Age' while maintaining the percentage utilization in the 'Survivor (To)' as specified by the **-XX:+NeverTenure** and **-XX:+AlwaysTenure**, which encouraged never to be used to tenure an object (risky to use). The opposite usage is to always tenure, which means to always use the 'old generation'.
The garbage collection that happens here is the major garbage collection (Major GC). This is usually triggered when the heap is full or the old generation is full. This is usually a 'Stop-the-World' event or thread that takes over to perform the garbage collection. There is another type of GC named full garbage collection (Full GC) which involves other memory areas such as the permgen space.
Other important and interesting flags related to the overall heap are **-XX:SurvivorRatio** and **-XX:NewRatio**, which specify the eden space to the survivor space ratio and old generation to the new generation ratio.
[Permanent Generation] Permgen space
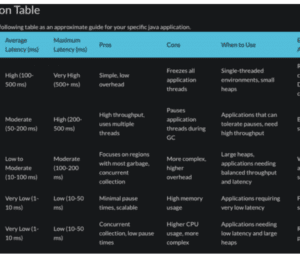
→ Garbage Collection Algorithms
Serial GC (-XX:UseSerialGC): GC on Young Generation and Old Generation
Parallel GC (-XX:UseParallelGC): GC on Young Generation and Old Generation
Parallel Old GC (-XX:UseParallelOldGC): GC on Young Generation and Old Generation
Concurrent Mark and Sweep GC (-XX:ConcMarkSweepGC): GC on Old Generaton
G1 GC (-XX:UseG1GC): GC on Young and Old Generation (By Dividing Heap into Equal Size Regions)
→ Most Common Out of Memory Issues
- Exception in thread "main": java.lang.OutOfMemoryError: Java heap space.
This does not necessarily imply a memory leak — as it could be due to lesser space configured for the heap. Otherwise, in a long-lived application it could be due to an unintentional reference being mentioned to heap objects (memory leak). Even the APIs that are called by the application could be holding references to objects that are unwarranted. Also, in applications that make excessive use of finalizers, sometimes the objects are queued into a finalization queue. When such an application creates higher priority threads and that leads to more and more objects in the finalizaton queue, it can cause an Out-of-Memory.
- Exception in thread "main": java.lang.OutOfMemoryError:PermGen space.
If there are many classes and methods loaded or if there are many string literals created, especially through the use of intern() (From JDK 7 on, interned strings are no longer part of the PermGen), then this type of error occurs. When this kind of error occurs, the text ClassLoader.defineClass might appear near the top of the stack trace that is printed.
- Exception in thread "main": java.lang.OutOfMemoryError: Requested array size exceeds VM limit.
This again happens when the requested array size is greater than the available heap size. It may usually occur due to programmatic errors during runtime if an incredibly large value is requested for an array size.
- Exception in thread "main": java.lang.OutOfMemoryError: request bytes for [r]. Out of swap space?
It is often the root cause of a memory leak. It happens when either the Operating System does not have sufficient swap space or when Another Process hogs all the available memory resources on the system. In simple terms, it was unable to provide the request space from heap due to exhaustion of space. The message indicates the size 's' (in bytes) of the request that failed and the reason 'r' for the memory request. In most cases the [r] part of the message is the name of a source module reporting the allocation failure, although in some cases it indicates a reason.
- Exception in thread "main": java.lang.OutOfMemoryError: (Native method).
This indicates that a Native method has met with an allocation failure. The root cause was that the error occurred in JNI rather than in the code executing inside the JVM. When the native code does not check for memory allocation errors, then the application crashes instead of going out of memory.
♦ Definition of Memory Leak
**From [Wikipedia](https://en.wikipedia.org/wiki/Memory_leak)**:
♦ Common Definitions of Memory Leak in Java
Memory leak in Java is a situation where some objects are not used by application any more, but GC fails to recognize them as unused.
A Memory Leak appears when an object is no longer used in the program but is still referenced somewhere at a location that is not reachable. Thus, the garbage collector cannot delete it. The memory space used for this object will not be released and the total memory used for the program will grow. This will degrade performances over time and the JVM may run out of memory.
In a way, Memory Leak would occur when No Memory can be Allocated on the Tenured Space.
Some of the most common causes of Memory Leaks are:
- ThreadLocal Variables
- Circular and Complex Bi-Directional References
- JNI Memory Leaks
- Static Fields that are Mutable (Most Common)
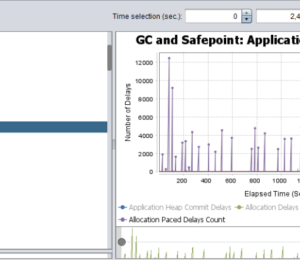
I recommend the usage of Visual VM bundled with the JDK to start debugging your memory leak issues.
♦ Common Debugging of Memory Leaks
1. NetBeans Profiler
2. Using the jhat Utility
3. Creating a Heap Dump
4. Obtaining a Heap Histogram on a Running Process
5. Obtaining a Heap Histogram at OutOfMemoryError
6. Monitoring the Number of Objects Pending Finalization
7. Third Party Memory Debuggers
The common strategies or steps for going about debugging memory leak issues include:
- Identify Symptoms
- Enable Verbose Garbage Collection
- Enable Profiling
- Analyze the Trace
- February 25, 2021
- 6 min read
Software Professional from India at Level of a [Principal Java/J2EE Architect]. [Intro] https://bit.ly/skp-tech-author


Comments (0)
No comments yet. Be the first.