

Analyzing and Tuning Warm-up of the JVM with Azul Zulu Prime Builds of OpenJDK
- April 01, 2023
- 11 min read
- Tune the Delivery of Full Falcon Optimizations
- Using Lower Optimization Levels
- Setting Falcon to Compile Only Recently Hot Methods
Warm-up is the time taken for the Java application to reach the optimum compiled code performance.
It is the task of the Just-in-Time (JIT) compiler to deliver optimal performance by producing optimized compiled code from application bytecode. This article will give you a basic understanding of how JIT compilation works and how to optimize warm-up using Azul Zulu Prime Builds of OpenJDK (Azul Zulu Prime JDK).
This post has been reviewed and extended on July 20th of 2023 thanks to the contributions of Matt Van Order.
An Introduction to JIT Compilation
When people think of Java compilers, they usually think about javac, which turns your Java source code into Java bytecode. But equally important is JIT compilation, which turns your Java bytecode into optimized machine code for the specific hardware on which your Java program is running.
When you first start your Java program, the JVM takes the platform-independent bytecode and runs it in the interpreter, which takes more CPU resources and is slower to execute. After a certain number of invocations (default 1K), the method is promoted to a profiling tier, known as the Tier 1 compiler or C1. Here the JVM monitors the method to build a profile of how many times each method is called, with which code paths, and how they are executed in the profiled method. After the compile threshold is reached (default 10K), the JVM promotes the method to the Tier 2 compiler by putting it in the Tier 2 compile queue. The Tier 2 compiler uses the Tier 1 profile to compile methods into highly optimized machine code.
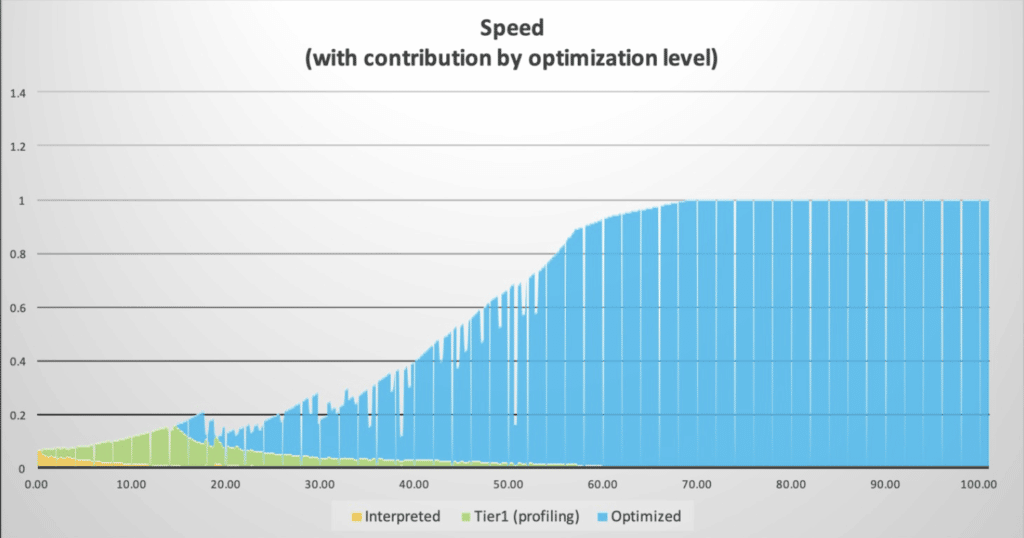
Because JIT compilation needs to use the same resources that your program runs, JIT compilers are usually very conservative in their operations. The performance of your application is lower and less stable during the warm-up phase when the JVM is identifying and compiling all hot methods. Eventually, compilation activity settles down and your code achieves its optimum stable performance.
NOTE: JIT optimization is often only one part of what is commonly seen as "warm-up". Other parts of warm-up include initializing resources needed by the application, rehydrating data from caches, etc. If you are experiencing long warm-up times, make sure to analyze everything that is happening during warm-up.
JIT compilers make speculations on the best way to optimize methods based on the usage seen in the life of the program so far. Sometimes those speculations turn out to be incorrect. When this happens, the JVM performs a de-optimization, or deopt, in which the compiled method is discarded and the method is run in the interpreter or in Tier 1 until the JIT compiler can provide a newly compiled method that matches the new usage patterns.
Azul Zulu Prime JDK and the Falcon JIT Compiler
Azul Zulu Prime JDK replaces OpenJDK’s HotSpot JIT compiler with Azul’s Falcon JIT compiler. Unlike HotSpot, Falcon has different levels of optimizations that you can use to balance eventual code speed versus how much time and computer resources you can commit to JIT warmup.
Wherever you have enough CPU capacity and time to warm up using full Falcon optimizations running locally on your JVM, you should do so. Full Falcon optimizations deliver the best performance and infrastructure savings.
There are many reasons to be sensitive to long warm-up, even if it delivers higher eventual speed:
- Long warm-up times make CI/CD rolling upgrades of a fleet of VMs is too long.
- Your SLAs mean you can’t start accepting traffic on a newly started node until it can serve requests at a certain speed.
- You have policies in place that throttle traffic or spin up new instances when CPU utilization goes over a certain percentage.
- You have to reserve capacity on your machines for the spike in CPU activity during warm-up, even though you do not need those resources for the regular running of your application.
Tuning JIT Compilation
Tune the Delivery of Full Falcon Optimizations
The Falcon compiler can be tuned in several ways:
- Give Falcon more threads. The normal heuristic is for Falcon to be allocated 2/3 of the total threads, but on a small machine, it can get rounded down to 1. You give Falcon a specific number of threads using the following flag:
-XX:CIMaxCompilerThreads=3(= 3 threads in this example).
NOTE:
-XX:CIMaxCompilerThreads=3will increase both Tier 1 (C1) and Tier 2 (C2) compiler threads. In case you want to distinguish between Tier 1 and Tier 2, the flags-XX:C1MaxCompilerThreads=3and-XX:C2MaxCompilerThreads=3can be used.
- Lower the Falcon compile threshold. The default threshold is 10K, which means a method must be invoked 10K times before it is put in the compilation queue. Lowering this number improves the warm-up curve but means there will be more compilation activity as more methods would be compiled when reaching 5K invocations while not reaching 10K invocations at all with the default value. Set the compile threshold using
-XX:Tier2CompileThreshold=5000.
NOTE: With Azul Zulu Prime JDK
-XX:Tier2CompileThreshold=5000behaves the same way as-XX:FalconCompileThreshold=5000, as Falcon is the Tier 2 compiler, or C2, in Azul Prime. This means-XX:Tier2CompileThresholdworks both for OpenJDK and Azul Prime.
- Lower the C1 compile threshold using
XX:C1CompileThreshold=100. C1, or client compiler, generally uses less memory and compiles methods quicker than C2 but not at a cost. Since C2 compiled code is better optimized, it is often worthwhile to use C2 compiled code rather than C1 compiled code, but only where total startup time is not a concern. If startup time is a concern and the goal is to get a better warmup time, it is better to run through methods using C1 compilation. This is easily achieved by lowering the C1 compile threshold. In Azul Prime,C1CompileThresholdis set to 1000 by default.
- Give extra resources to the compiler for a set amount of time. Normally, the Compiler must share resources with executed code. Using
-XX:CompilerWarmupPeriodSeconds, setting a timeframe to exclusively run the compiler during warmup, together with-XX:CompilerWarmupExtraThreads, allocating an extra number of threads to the compiler during warmup, will tell the JVM to give all available resources to the compiler for a set amount of time. After which, resources can finally be used by the application. This can greatly speed up warmup time but also restricts the use of the application during warmup.
Using Lower Optimization Levels
If you have tweaked the above settings and your warm-up time is still too long, you can lower optimization levels from Full Falcon down to the KestrelC2 compiler (light-weight Falcon). Each optimization level will give lower compile time and lower code speed. Each lower optimization level yields a drop in speed of C2 compilation from the next higher optimization level, in most cases, but also reduces the total compile time.
Available levels of optimization are described below:
- Falcon Optimization Level 2 - Full Falcon: the full set of super-optimizations that deliver on average 20-30% faster code than OpenJDK’s HotSpot compiler. This is the recommended approach and the default configuration.
- Falcon Optimization Level 1 - code runs about 5% slower than Opt level 2 and reduces the compile time by about 50%. Enabled using the following option:
-XX:FalconOptimizationLevel=1
- Falcon Optimization Level 0 - code runs about 30% slower than Opt level 2 and reduces the compile time by about 70%. Opt level 0 is roughly comparable to Zulu C2 performance. Enabled using the following option:
-XX:FalconOptimizationLevel=0
- KestrelC2: a limited set of optimizations designed to approximate the warm-up costs and eventual code speed of OpenJDK’s HotSpot compiler. Code compiled with KestrelC2 will have a lower eventual speed than code compiled with full Falcon optimizations, but will reach an optimal state faster and with fewer resources. Enabled using the following option:
-XX:+UseKestrelC2
Different compiler options can be used to lowering the optimization levels and affect the amount of time and CPU Falcon uses to optimize your code. For more info on this topic, check Command Line Options > Falcon Compiler Options.
A solution for the slower optimized code in these circumstances is provided by Azul’s Cloud Native Compiler.
Setting Falcon to Compile Only Recently Hot Methods
As your compile queue builds up, it can contain many methods that were once hot but are now no longer used and therefore are not as critical to compile. An example is an application platform that first performs many initialization operations and then has a different set of methods that are called once the app is initialized.
You may have lots of methods in your compile queue for things that the application was doing when initializing but are no longer being called. Compiling these methods once initialization is already done is therefore wasted work.
You can train Falcon to focus only on compiling methods that were recently hot using the -XX:TopTierCompileThresholdTriggerMillis flag. This flag controls the triggering time limit (in ms) in which the method needs to reach the compile threshold in order to be queued for compilation. If the threshold is reached, but not within this time limit, the method is ignored and the timer starts over again.
Analyzing Java Warm-up
So how do you know if your application is warmed up? The best way is by measuring the performance of your program by whatever metric you would normally measure it with. This could be operations/second or service time. Run a very long test and see how long it takes to reach 99% of peak performance and remain steadily at that level for a long period of time.
Note that JIT compilers often keep performing optimizations long after you’ve reached your optimal peak performance. Therefore, you see higher CPU activity even after your code is running at optimal peak performance.
When analyzing the compiler behavior, Azul Platform Prime’s Garbage Collector (GC) log file is the first information source to look into because this log file not only tracks GC information. On Azul Platform Prime, the log also contains much information about compilation activity and general system resources utilization.
Add this flag to the Java command line to enable GC logging: -Xlog:gc,safepoint:gc.log::filecount=0. The filecount=0 setting disables log file rotation, resulting in one single log file which simplifies the tuning workflow. For further details about GC logging see Unified Garbage Collection Logging Recommendations and Advanced tuning hints.
After your test, open the log file in the Azul GC Log Analyzer (download). With this tool you can check the following information:
- Number of threads/cores available for JIT compilation
- Total number of threads/cores and RAM for the process
- Compiler Queues: shows the number of methods waiting for compilation over time. Large numbers of methods in the compiler queues mean that Falcon does not have enough resources to handle all incoming requests
- Compiler Threads: shows how many threads were used over time for the JIT compilation
- Tier 2 Compile Counts and Tier 2 Wait Time Distribution: shows the full amount of compilations requested over the life of the process and how long it took to fulfill requests.
Example Case
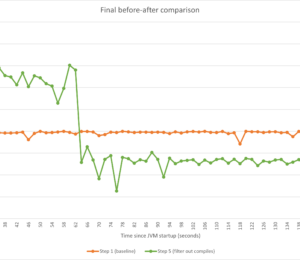
Let’s compare the results of running the same application with or without certain parameters to see the impact on the warm-up. We let the application run for the same duration, which is long enough to reach a stable state, with the same load to ensure the maximum benefit from the Falcon compiler is reached, and similar use cases are compared.
This test application is run on a small machine to see the impact of threads on warm-up. First, no parameters were used. In a second run of the same test, startup parameters were added: -XX:CIMaxCompilerThreads=3 to use more threads, and -XX:Tier2CompileThreshold=5000 for a lower compiler threshold instead of the default 10K.
System Information
Let’s look at an example GC log. Open the log by running java -jar GCLogAnalyzer2.jar gc.log. Click the ![]() button to see the overall information about the process:
button to see the overall information about the process:
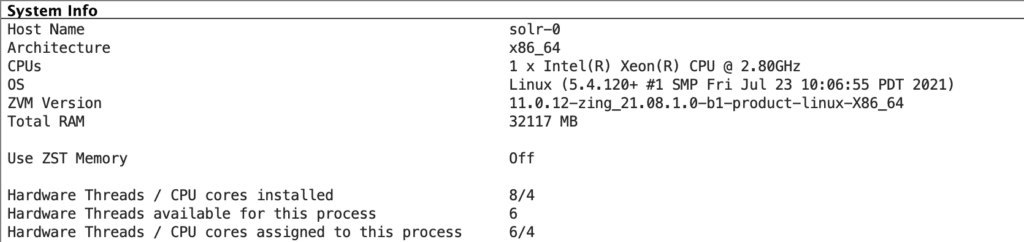
You can see that the process is running on 6 threads overall. Scrolling down to the bottom, you see the following for the test without additional parameters:
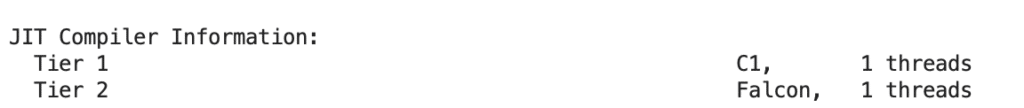
So there is only one thread for JIT compilation, which is generally not recommended for on-JVM JIT compilation on Azul Zulu Prime JDK.
NOTE: If you need to run on resource-constrained machines, consider off-loading JIT compilation to Cloud Native Compiler.
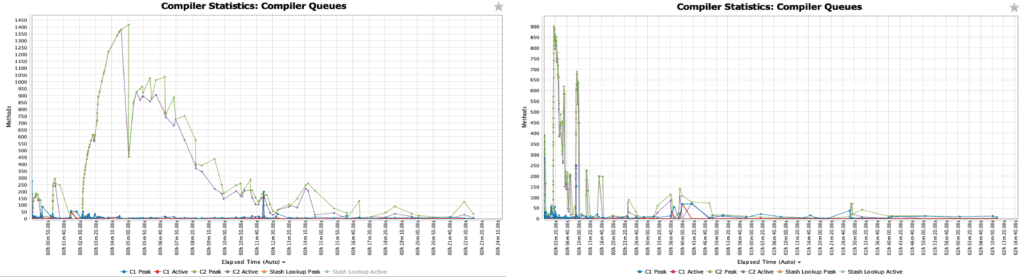
Compiler Queues
Click "Compiler Statistics" > "Compiler Queues" to see the backlog of methods in the Tier 2 Falcon compile queue. The left image shows a large backlog. In the second run a much smaller amount of compile queues is being handled, much more quickly.
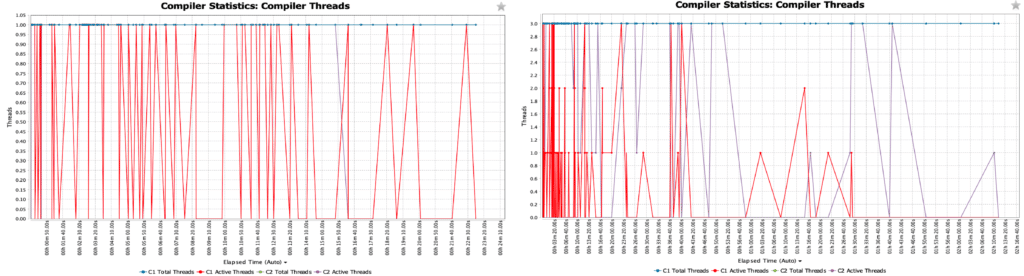
Compiler Threads
Clicking "Compiler Statistics" > "Compiler Threads" shows there is just one Tier 2 thread which is getting maxed out. With the same additional flags for extra threads and lower compiler threshold, there is a more reasonable use of the three compiler threads over time rather than one thread being constantly maxed out.
Compile Counts
Clicking "Compiler Statistics" > "Tier 2 Compile Counts" shows a large number of the methods being evicted from the queue before they can be compiled. In the second run, the Compile Counts shows a much smaller number of methods getting evicted from the queue.
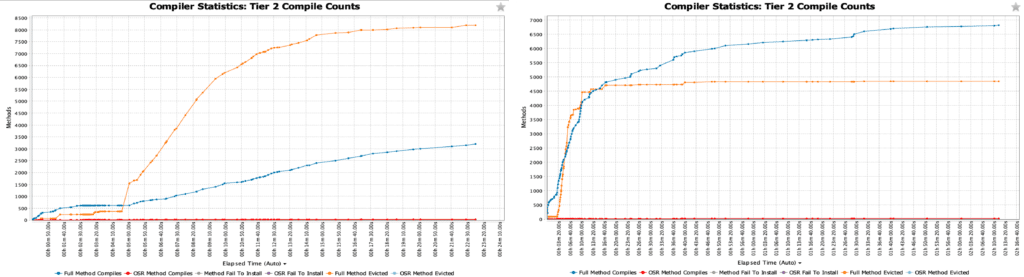
NOTE: A lot of evicted methods is not always a bad thing. It just demonstrates that the application has phases and some methods are not used within some period of time. For example: Falcon didn’t compile the incoming requests in time and the application just switched to another phase and certain methods are no longer needed. If methods are executed by the application later again they would be enqueued again, so no worries.
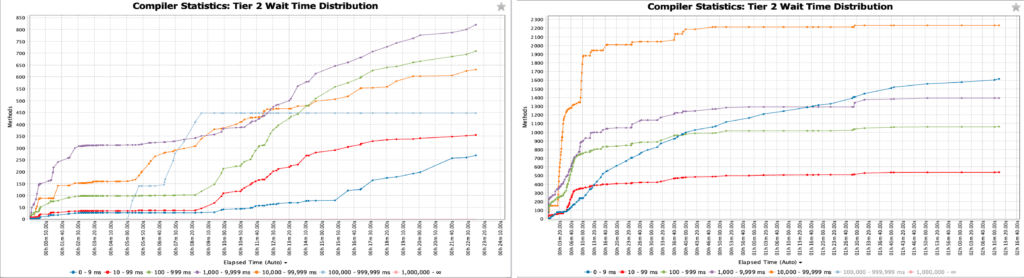
Wait Distribution Time
Clicking "Tier 2 Wait Time Distribution" shows our JVM is experiencing long wait times for compiled methods in the first run, while the second run shows much better times to respond with compiled methods.
Eviction From the Compiler Queue
The JVM enqueues a massive number of methods for compilation as your program starts. Most programs have different phases of execution. For example, your program could have an initialization phase followed by a steady run phase. The methods that are the hottest in the initialization phase may not be the same methods that are needed when you move to your steady run phase.
Azul Zulu Prime JDK optimizes for this situation by continuing to count invocations after the compilation threshold has been reached. Every time there are another 10K invocations, the JVM increments a counter on the method. If the counter hasn’t been incremented in 20s, meaning it hasn’t been called 10K times in the last 20 seconds, the method is evicted from the compile queue. You can disable the eviction policy using -XX:TopTierCompileQueueEvictAfterMs=-1.
Use Cloud Native Compiler
We often see cases where customers want to take advantage of full Falcon super-optimizations but are running on small machines whose resource constraints make it difficult. That’s why Azul has developed Cloud Native Compiler. Cloud Native Compiler provides a server-side optimization solution that offloads JIT compilation to dedicated hardware, providing more processing power to JIT compilation while freeing your client JVMs from the load of doing JIT compilation.
For more information, see the Cloud Native Compiler documentation.
Use ReadyNow Warm-Up Optimizer
ReadyNow is a feature of Azul Zulu Prime JDK that can dramatically reduce your warm-up time. ReadyNow persists the profiling information gathered during the run of the application so that subsequent runs do not have to learn again from scratch. On the next run, ReadyNow pre-compiles all the methods in the profile before launching the Main method.
For more information, see the ReadyNow documentation.
Advanced Tuning Hints
When problems have been identified from the log-file analysis, you can dive even deeper into this process by running your application with additional flags that will give you more information.
To get a full picture of JIT compilation, use the -XX:+PrintCompilation and -XX:+TraceDeoptimizations flags to print info to the vm output. You can also redirect this output into a separate log file by using -XX:+LogVMOutput -XX:-DisplayVMOutput -XX:LogFile=vm.log -XX:+PrintCompilation -XX:+TraceDeoptimization.
- April 01, 2023
- 11 min read
Frank Delporte is a Java Champion, Java Developer, Senior Technical Writer at Azul, Blogger, Author of "Java Programming for Raspberry Pi - A Hands-On Guide to Electronics and IoT Projects", and Open-Source Contributor for Pi4J, Lottie4J, MelodyMatrix,... Frank writes and talks about Java in business production environments, but also in places people don’t always expect it, on the Raspberry Pi, driving GPIO pins, rendering JavaFX UIs, and running on RISC-V single-board computers.
Java developer with years of experience developing systems for television and news broadcasting. Senior Technical Writer at Azul, with a focus on Azul Platform Prime.


Comments (1)
Java Weekly, Issue 460 | Baeldung
2 years ago[…] >> Analyzing and Tuning Warm-up of the JVM with Azul Zulu Prime Builds of OpenJDK [foojay.io] […]