Effective Cloud-Native Development with Open Liberty in Visual Studio Code
- December 05, 2023
- 6 min read
- View and access all detected Liberty projects in your IDE in the Liberty Dashboard
- Rapid, iterative development with Liberty dev mode
- Effective testing and debugging within the IDE
- Editing assistance for configuration files
- Coding assistance for Jakarta EE and MicroProfile APIs
Open Liberty is a lightweight, open cloud-native runtime, great for building fast and efficient cloud-native Java applications. If you’re unfamiliar with Open Liberty, and want to learn more, check out the “Why cloud-native Java developers love Liberty” article.
However, choosing an effective cloud-native Java runtime for your application doesn’t always directly equate to efficient creation of cloud-native applications. As developers, it’s important we use these runtimes and supporting tools effectively to enable an efficient development cycle and ensure productivity within our development teams.
As cloud-native developers, you have to care not only about developing your application, but also the building, deployment, and management of it in production. These added tasks create a complex and often challenging environment, which causes you to be constantly switching between different platforms, tools, and frameworks.
What you need is a way in which you could complete this diverse set of tasks, with language and framework support, all within one IDE. The open source Liberty Tools for Visual Studio Code, offers just this option, helping you in developing, building, testing, deploying, and managing your applications – all within your favorite IDE, Visual Studio Code!
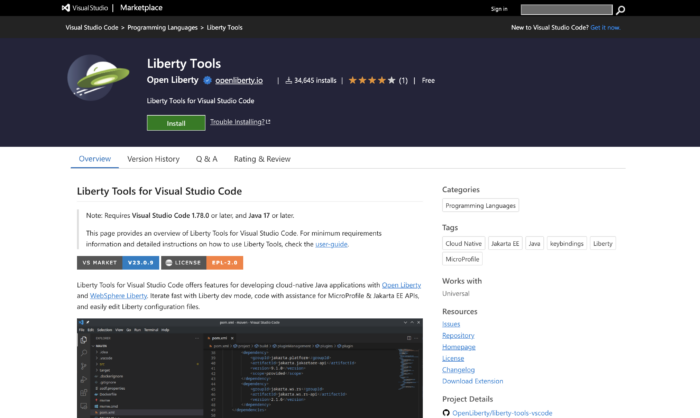
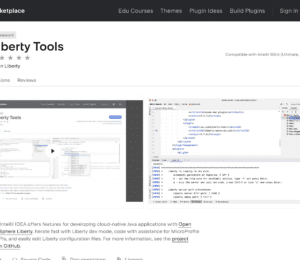
Liberty Tools is a set of intuitive developer tools that provide a simplified yet powerful development experience. They support popular integrated development environments (IDEs) including Visual Studio Code, available as an extension.
Key Capabilities of Liberty Tools
These tools introduce capabilities that really empower you to develop, test, debug, and manage applications without having to leave your IDE, including:
- Easily view and access all detected Liberty projects in your IDE in the Liberty Dashboard
- Rapid, iterative development with Liberty dev mode
- Effective testing and debugging all within the IDE
- Editing assistance for you to easily make changes to their configuration files
- Coding assistance for you to write applications that use Jakarta EE (9.x and later) and MicroProfile (3.x and later) APIs, including validations, quick fixes, and completions
In this article, we’ll dive further into these capabilities. If you want to view a deep dive tutorial on this tool, then watch the Developer Deep Dive of Liberty Tools for Visual Studio Code video. Clips of this video are used in this article to showcase these capabilities.
View and access all detected Liberty projects in your IDE in the Liberty Dashboard
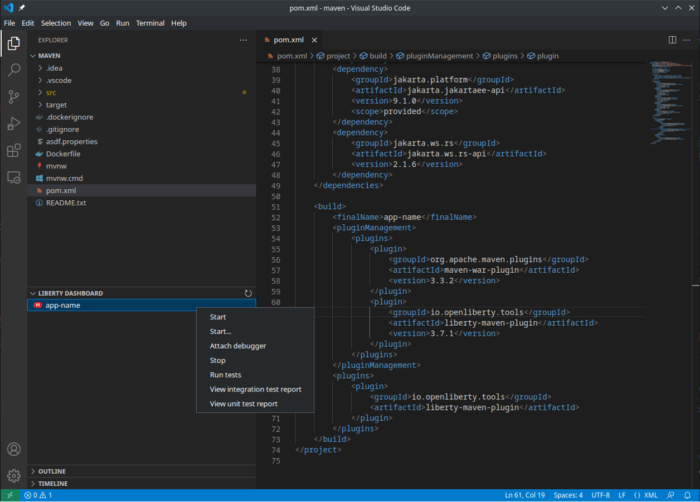
Liberty Tools automatically detects Liberty Maven or Gradle projects. These projects are added to a special Liberty dashboard view in Visual Studio Code. From this dashboard, you can access a command menu to manage your projects. Now, you don’t have to spend time creating and managing Liberty instances, which frees up your time to focus on the code itself.
Rapid, iterative development with Liberty dev mode
Liberty dev mode automatically detects, recompiles, and deploys code changes whenever you save a new change. It also runs unit and integration tests on demand and can attach a debugger to the running server to step through your code at any time. Liberty Tools brings these dev mode features directly into the command menu for the Liberty projects in your editor. With just a few clicks, you can start and stop your Liberty application, run tests, and view test reports.
Liberty dev mode enables rapid, iterative development in a manner that aligns with agile development practices that are recommended for cloud-native applications. See how you can get started rapidly with dev mode using Liberty Tools in the following video. To try this for yourself, follow the steps in the Liberty Tools user guide to run your app on Liberty using dev mode.
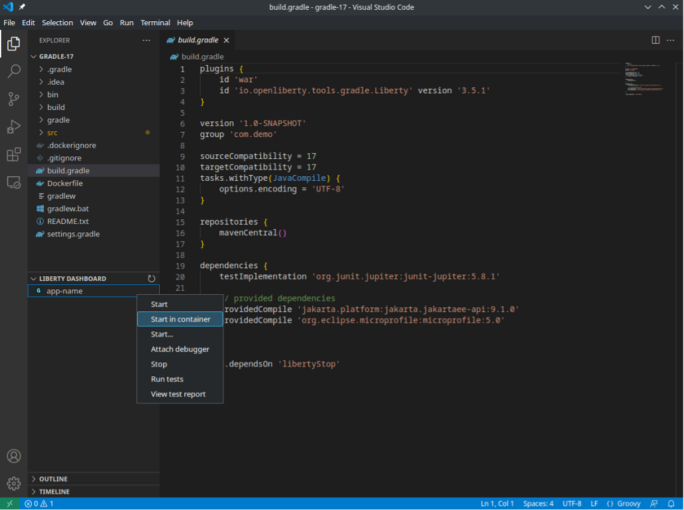
You can also run your application in dev mode in a container. When dev mode runs with container support, it builds a container image and runs the container. For more information on dev mode for containers, check out the Liberty Maven devc goal or the Liberty Gradle libertyDevc task.
Effective testing and debugging within the IDE
When your application is running on Liberty using dev mode, you can easily run the tests provided by your application. To do the tests, select the Run tests command in the Liberty dashboard. You can also configure Liberty to automatically re-run tests after you’ve made changes. After the application tests finish running, you can access the test reports that were generated. The reports vary depending on what build tool you have used.
You can follow the steps in the Liberty Tools user guide to run your application tests and view your application test results. Or, check out the following video to see for yourself just how easy this can be with Liberty Tools.
You can also attach a debugger to a running Liberty instance using the "Attach debugger" command in the Liberty Dashboard, which makes the standard Visual Studio Code debug options available. The following video shows how this can be achieved with just a few clicks with Liberty Tools in your VS Code IDE. For more on this, you can see the steps required in the Liberty Tools user guide section: debug your application.
Editing assistance for configuration files
You can also use Liberty Tools to get Liberty configuration editing assistance through the Liberty Config Language Server, such as code completion, diagnostics, and quick-fixes, in Liberty server.xml, server.env, and bootstrap.properties files.
To use Liberty-specific code completion, press Ctrl + Space or Cmd + Space anywhere in the document and a drop-down list of completion suggestions will appear. To see an example of what this editing assistance is like, check out the following video, or try following the steps in the Liberty Tools user guide for configuring a Liberty server with configuration assistance.
Coding assistance for Jakarta EE and MicroProfile APIs
Liberty Tools coding assistance also provide helpful language-support features such as code completion, diagnostics, and quick-fixes in configuration and application files for Jakarta EE and MicroProfile APIs.
The Jakarta EE API coding assistance is offered through Eclipse LSP4Jakarta, the Language Server for Jakarta EE. The following video showcases some of the functionality enabled through the LSP4Jakarta project which is included as part of Liberty Tools.
The MicroProfile EE API coding assistance is offered through Eclipse LSP4MP, the Language Server for MicroProfile. The following video showcases similar coding assistance features but specifically for MicroProfile.
You can follow the steps in the Liberty Tools user guide to develop with Jakarta EE and MicroProfile APIs with coding assistance.
Start using Liberty Tools in Visual Studio Code
Before you can use Liberty Tools in Visual Studio Code, you must satisfy these requirements:
- Java 17 (or later) is needed to run the extension (but you can choose a different version of Java to run your application)
- Visual Studio Code 1.78.0 or later
- Install the Liberty Tools for Visual Studio Code extension
- Liberty Maven plugin or Liberty Gradle plugin configured in the
pom.xmlorbuild.gradlefile for your app. Use the most recent version of the plugin to get important bug fixes.
When installed, the Liberty dashboard displays in the Project Explorer. Projects that are already properly configured to run on Liberty and use Liberty dev mode are automatically added to the Liberty dashboard when it opens.

Projects that are already properly configured to run on Liberty and use Liberty dev mode are automatically added to the Liberty dashboard when it opens.
Summary and next steps
With the Liberty Tools extension in Visual Studio Code, you can efficiently develop, deploy, debug, test, and manage your cloud-native Java applications.
Now that you have Liberty Tools set up in your IDE, why not try using it with some of the Open Liberty guides or tutorials?
We'd also love to get your feedback on our tools. So, if you do have a go with them or if you use them already, please do let us know what you think and what we can do to improve them! Our GitHub page can be found here where you can raise issues, create PRs or even star our project: https://github.com/OpenLiberty/liberty-tools-vscode.
You can also check out at this related VS Code content on Foojay.io:
- Java on Visual Studio Code – May 2023
- https://foojay.io/java-quick-start/quick-start-tutorial/choosing-an-editor/
- Foojay Podcast #12: State and Future of the IDEs
- December 05, 2023
- 6 min read




Comments (0)
No comments yet. Be the first.