Profiling Maven Projects with my IntelliJ Profiler Plugin
- December 14, 2023
- 3 min read
Or: I just released version 0.0.11 with a cool new feature that I can't wait to tell you about...
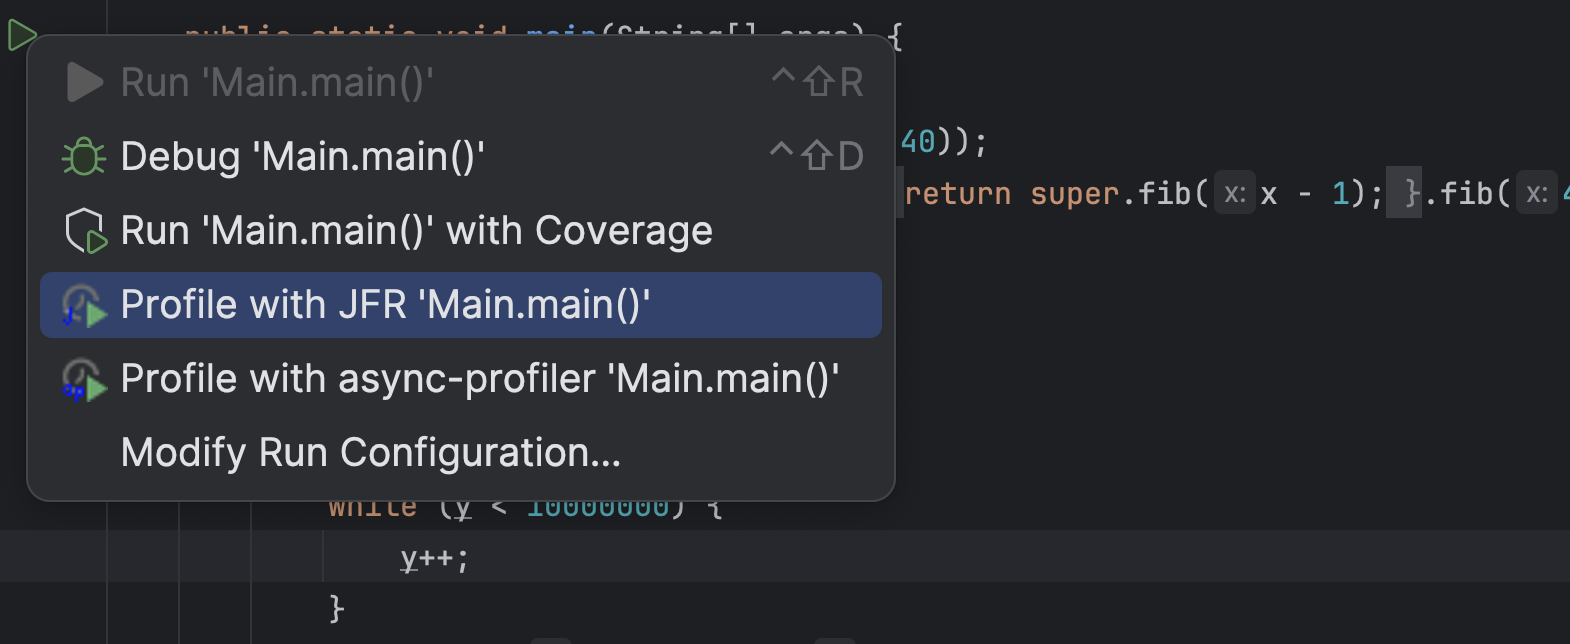
According to the recent JetBrains survey, most people use Maven as their build system and build Spring Boot applications with Java. Yet my profiling plugin for IntelliJ only supports profiling pure Java run configurations. Configurations where the JVM gets passed the main class to run. This is great for tiny examples where you directly right-click on the main method and profile the whole application using the context menu:

But this is not great when you're using the Maven build system and usually run your application using the exec goal, or, god forbid, use Spring Boot or Quarkus-related goals. Support for these goals has been requested multiple times, and last week, I came around to implementing it (while also two other bugs). So now you can profile your Spring Boot, like the Spring pet-clinic, application running with spring-boot:run:

Giving you a profile like:

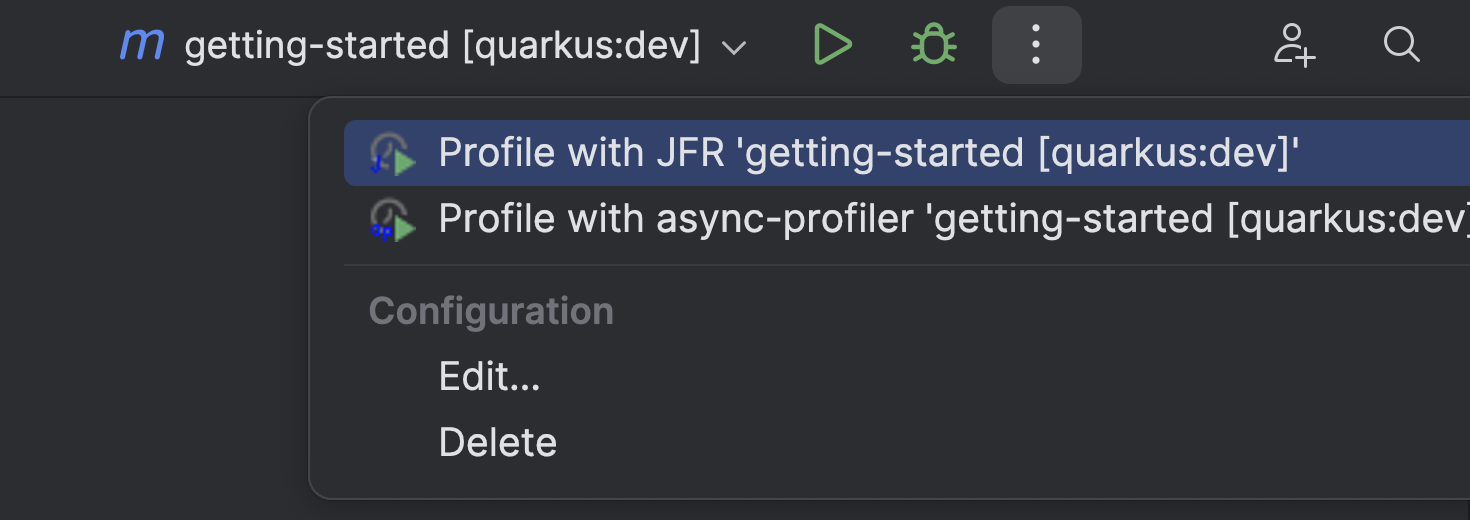
Or your Quarkus application running with quarkus:dev:

Giving you a profile like:

This works specifically by using the options of these goals, which allows the profiler plugin to pass profiling-specific JVM options. If the plugin doesn't detect a directly supported plugin, it passes the JVM options via the MAVEN_OPTS environment variable. This should work with the exec goals and others.
Gradle script support has also been requested, but despite searching the whole internet till the night, I didn't find any way to add JVM options to the JVM that Gradle runs for the Spring Boot or run tasks without modifying the build.gradle file itself (see Baeldung).

Only Quarku's quarkusDev task has the proper options so that I can pass the JVM options. So, for now, I only have basic Quarkus support but nothing else. Maybe one of my readers knows how I could still provide profiling support for non-Quarkus projects.
You can configure the options that the plugin uses for specific task prefixes yourself in the .profileconfig.json file:
{
    "additionalGradleTargets": [
        {
            // example for Quarkus
            "targetPrefix": "quarkus",
            "optionForVmArgs": "-Djvm.args",
            "description": "Example quarkus config, adding profiling arguments via -Djvm.args option to the Gradle task run"
        }
    ],
    "additionalMavenTargets": [
        {   // example for Quarkus
            "targetPrefix": "quarkus:",
            "optionForVmArgs": "-Djvm.args",
            "description": "Example quarkus config, adding profiling arguments via -Djvm.args option to the Maven goal run"
        }
    ]
}
This update has been the first one with new features since April. The new features should make life easier for profiling both real-world and toy applications. If you have any other feature requests, feel free to create an issue on GitHub and, ideally, try to create a pull request. I'm happy to help you get started.
See you next week on some topics I have not yet decided on. I have far more ideas than time...
This article is part of my work in the SapMachine team at SAP, making profiling and debugging easier for everyone. Thanks to the issue reporters and all the other people who tried my plugin.
- December 14, 2023
- 3 min read


Comments (0)
No comments yet. Be the first.