

What Should I Know About Garbage Collection as a Java Developer?
- February 03, 2023
- 12 min read
- Different Stages in Garbage Collection
- The Importance of Live Set and Allocation Rate
- Generational Heaps
- Which Garbage Collector to Use?
- Impact on the Runtime Environment
- Select Two Out of Three
- About Concurrent Garbage Collectors
- Throughput Under Service Level Expectation
- Monitor Resource Usage for Optimal Garbage Collector Behaviour
The Garbage Collector is a crucial part of the Java Virtual Machine (JVM) that has an impact on the performance and reliability of your application.
But what is it exactly, and why is it important to understand how it works? If you’re a Java developer, you might ask, “What should I know about Garbage Collection?”
Since I joined Azul as technical writer, it was a real discovery to talk to the engineers who develop such GCs and help companies get the most out of their Java systems.
What is the Garbage Collector?
In many other programming languages, programmers manage the creation and removal of objects to moderate memory usage. In Java, programmers focus on application functionality while the Garbage Collector (GC) controls how memory is used.
The GC automatically frees the memory space consumed by objects which are no longer used. When objects stored in memory have become “unreachable” for the program, the GC detects them and cleans them up.
Thanks to the GC in the Java Virtual Machine, Java applications generally avoid the accidental memory leaks and fragmentation issues affecting C/C++. Java applications have reliable uptimes of months, removing the need for scheduled reboots.
So it is clear the GC is at the center of memory management for Java applications, but other applications take different approaches:
- All memory allocated at startup or start of a module: this is, for instance, used in Fortran (pre-Fortran90) and Cobol
- Explicit allocation and freeing of memory in the heap are usually managed with a linked list: C, C++,…
- Managed memory exists in various ways:
- Compacting GC: this is the JAVA GC
- Scoped: Rust, Erlang
- Reference counting: the number of references for each object defines if an object is still in use
- A mix of scope and counting and a bit of GC
How Does a Garbage Collector Work?
A managed language like Java hides the complexity for you

John Cuthbertson, Principal Engineer, C4 GC team
I’ve been working on the Garbage Collectors in Java since version 1.1, initially on the G1 GC and later on the others. The most important message I want to share with developers is that the whole idea of a managed language – like Java – is that the complexity of such an essential and extensive implementation as a GC is actually “hidden” for you.
Which means you don’t need to care! Because a lot of developers are working hard on the runtime and the language itself, the vast user base of developers can benefit from all the work that is happening “under the hoods.” The initial GC in the original JVM was very limited and not working seamlessly, but thanks to all the evolutions, the current overhead of the GC is way less noticeable.
Please read on, but keep in mind that you can focus on your business logic, and the Java runtime will take care of the memory management – even if you are unaware of how much the GC is working for you! On the other hand, if you want to understand better how the GC can impact your program, there is a lot to learn here.
Different Stages in Garbage Collection
A GC process can follow different approaches and, in all cases, contains one or more of the following steps.
- Mark (= Trace): starting from the application’s root, all linked memory blocks that can be reached are “Painted.” Imagine this as a tree with branches, where all leaves are colored. When all endpoints of the branches are reached, the painted blocks can be considered as “Live,” while the remaining memory blocks that are not painted can be considered as “Non-Live.”
- Sweep: all the “Non-Live” objects are cleared from the heap memory.
- Compact: “Live” memory objects are brought closer together (defragmentation, relocation) to ensure big free memory blocks are available for new objects. Some collectors will have a second “pass” to update the references in the application to memory objects to make sure they are pointing to the correct locations in the memory.
- Copy: this is another method to improve how the memory is used. In this process, all the “Live” objects are moved to a “To” space, while the remaining objects in the “From” space can be considered as “Non-Live.”
There are multiple types of GCs depending on which of these approaches they use:
- Mark/Sweep/Compact
- Copy
- Mark/Compact
A few other terms related to how the GC is implemented are essential when you want to understand the GC process better.
- Single versus multiple passes:
- Single-pass: multiple steps are handled in a single run.
- Multi-pass: in a multi-pass, the steps are handled in different passes, one after the other.
- Serial versus Parallel:
- Serial: one GC thread
- Parallel: multiple GC threads
- Stop-The-World versus Concurrent:
- Stop-The-World: the application is stopped while the GC cycle is running.
- Concurrent: the GC is running “next to” the application and has no impact on the application execution.
The Importance of Live Set and Allocation Rate
As described in the different stages, the live set, which contains all the objects still in use, is an essential factor in the behavior of the GC. If a Java application has a constant load and behavior, and objects are added and removed from the live set steadily, its size will remain stable. A growing live set can be caused by a memory leak.
The -Xmx flag defines a Java application’s maximum heap size. If the size of the live set approaches the -Xmx size, the JVM lacks free memory to store new objects and perform the GC. This will decrease the performance.
To keep the size of your server well-dimensioned to run your application, you need to balance the amount of installed memory and the -Xmx value with the actual size of the live set. Overdimensioning your server is just a waste of money. But to correctly define this dimension, the allocation rate must be considered.
This allocation rate is a value based on the amount of memory allocated per time unit, for instance, MB/sec. A high value can indicate that a lot of objects are being created, resulting in the fact that a lot of cleanups will be needed. This will impact the frequency and/or duration of the GC pauses.
A good guideline for the heap size (-Xmx) is 2.5 to 5 times the size of the average live set. The higher the allocation rate, the bigger the heap must be for optimal GC.
Azul Zulu Prime builds of OpenJDK contain a mechanism called Allocation Pacing that helps to reduce peak allocation delays by limiting the allocation rate of the application when the heap usage approaches -Xmx as described in this blog post.
Generational Heaps
Another technique used in GC is “generational heaps,” keeping “young” versus “old” objects in different areas of the heap.
- Most objects die young
- Few references from older to younger objects exist.
Using this hypothesis, the Java heap is separated into two physical areas:
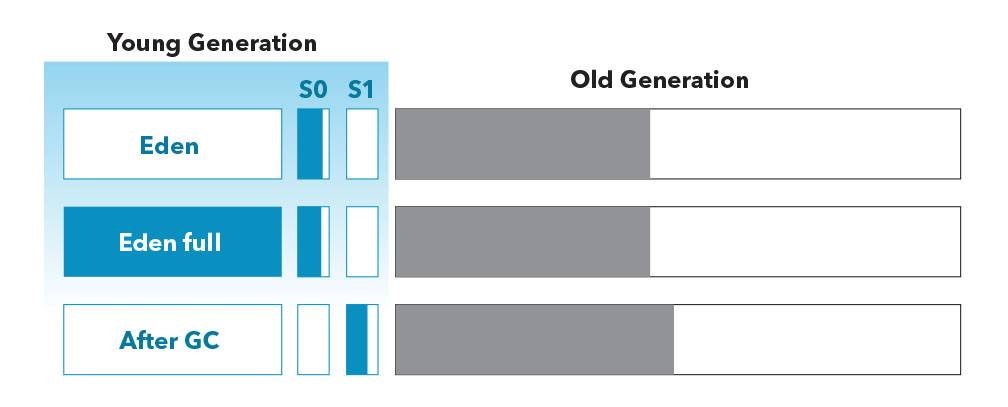
- Young generation: this is where new objects are allocated and where objects are stored which are not old enough to get promoted. This is typically a smaller set with a lot of garbage objects that is handled quickly by the GC. Typically Young Generation Stop-The-World GCs are single passes. The young generation is further divided into sections known as “Eden” and the “Survivor spaces” to move young objects if they are used for a longer time.
- Old generation: objects that live longer are eventually promoted to the old generation. This set is handled less frequently by the GC but takes a longer time.
In many cases, the Old generation is larger than the Young generation, but not always. This depends on the static working live set of the application and how elastic the boundary between the Young and Old generations is.
In region-based generational collectors (C4 and G1), the size of the generations is fluid and elastic. Most of the regions could be the Young generation, or most could be the Old generation. In collectors like CMS, Parallel, and Serial, the boundary between the two generations was fixed, and the ratio between new and old generation sizes may have to be tuned.
The following diagram illustrates how a typical Young generation GC cleans and moves objects when the Eden space gets filled up. New objects get allocated into the Eden space until it fills up. During the GC, live objects (reachable objects) in the Eden and Survivor space are copied to the other Survivor space. If any objects become “old enough,” they are copied to the Old generation (i.e. they are tenured).
You can take advantage of the young generation system by focusing on local variables within methods that have a short lifetime so the GC can focus on a subset of the heap that can quickly be handled.
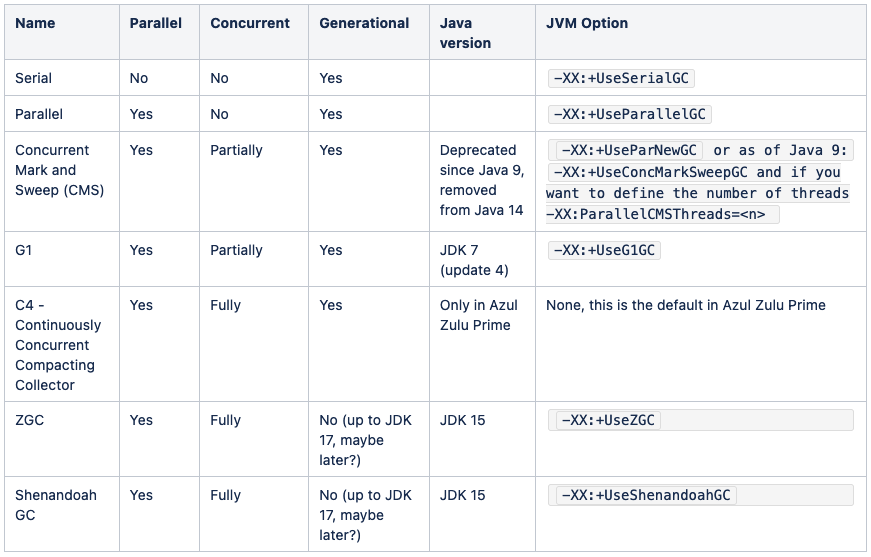
Types of Java Garbage Collectors
Just like Java-the-language has evolved, the runtime and tools have evolved a lot, and different GCs have been part of the JRE.
Some tips for older GC generations are no longer applicable

Deepak Sreedhar, Principal Software Engineer, GC Specialist
GCs have evolved a lot in recent decades. As a Java developer or DevOps, you need to be aware that some tips for older GC generations or not applicable anymore. C4, ZGC, and Shenandoah are truly concurrent.
The pause times with these modern GCs are very small, often units of milliseconds or even lower. The size of the live set (objects that cannot be collected because they have references that may still be used in the future) still determines the duration of the GC cycles, but the application is not paused while they are running.
The pause times do not scale with an increase in live set or heap size. Traditionally there has been a conscious attempt to design applications in such a way as to avoid needing larger Java heaps. Thanks to concurrent GCs, you can focus on the business logic and try to achieve the best possible speed of the functional flow of your program. And stop worrying about response time outliers because of GC!
One thing that developers still need to be careful about is avoiding leaks in the Java heap that can lead to high live sets for GC. The duration of, and CPU consumption by, most modern GCs is proportional to the size of live set. The Java ecosystem has several tools that can help analyze live sets and identify problems. And Azul support is always ready to provide any help we can!
Impact of the Garbage Collector on the Application
Which Garbage Collector to Use?
As should be clear by now, “The Garbage Collector” doesn’t exist; but depending on the version of your Java runtime and/or startup options, multiple ones are available, and you can even choose which one you want to use! But with this flexibility also comes some responsibility.
Do you just go for the default option, or do you want to use another one? The specialists at Azul are always available to guide new customers when they want to evaluate Azul Zulu Prime versus OpenJDK or other distributions, and they have a lot of experience in comparing different use cases.
Certain coding practices can have an impact on how Java uses memory

Michael Roeschter, Sales Engineer
The GC has a significant impact on how your application behaves. Still, as a developer, you should also be aware that certain coding practices can have an impact on how Java uses memory, and some problems can get also get fixed with a code change! One of the examples where we have seen such wins is in statistics and parser applications, where a lot of data is copied and only used once.
Creating and using short-lived small objects or ArrayLists is not a problem. But when large data structures are used in a “create to discard” mode,the memory allocation rate can get out of hand, and re-use of data structures can be beneficial. An example would be single-use large buffers or arrays containing millions of objects of the same size.
A generational GC that is optimized to make the difference between young and old objects works best when there are two “stereotypes” of data:
- Transactional data: objects that are created during a transaction or event and die within seconds or milliseconds.
- Reference data: data loaded once and referenced (read) but not modified by a transaction.
On the other hand, the “worst” kind of memory for a GC is a rolling buffer (FIFO), where data lives for minutes or hours.
This is not a programming issue but has a “business” reason – for example, when a rolling transaction log, session buffer, or similar must be used. When an application is constantly modifying its “old” long-lived data at a high rate, then non-concurrent GCs sooner or later run into trouble and need a full GC.
Impact on the Runtime Environment
Azul also has other technologies on top of OpenJDK that improve the performance of Java applications as this is not always only related to the behavior of the application itself but can also be impacted by the environment, cluster, or resources used within the organization.
Always consider the most urgent problem to solve

Daniel Witkowski, Sales Engineer
When we guide potential customers while evaluating Azul Zulu Prime, we always consider the most urgent problem to solve. Depending on that starting point, we will look at how Falcon, ReadyNow, or our C4 GC will provide the most significant win from the start. For specific projects, it is clear that the heap size is causing long pauses in the application execution caused by the Garbage Collector.
For example, projects where a 100Gb heap is used can expect pause times of over 10 seconds when the GC is cleaning up the memory. In other cases, for example, financial and gaming applications, a smaller heap of 10Gb size which stops for hundreds of milliseconds can already be a big problem. Anyhow, having a Garbage Collector that doesn’t stop your application completely for an unpredictable time is essential for every project that expects consistent short response times; low latency in other words.
Clusters are another example where we have seen problems caused by the GC. When one node with a big heap is considered dead because it is not responding during a GC cycle, a process is started to spin up a new node and redistribute the data… But suddenly, the node that is considered to be dead reappears after the GC cycle, causing a chain of undesired events in the cluster.
We have seen in different projects that the introduction of Azul Zulu Prime solved many problems that low latency specialists tried to solve in the code but are now entirely handled by the C4 Azul Zulu Prime Garbage Collector, removing all the pauses their application was experiencing.
Select Two Out of Three
In IT project management, there is a famous rule: "You need to choose between speed, quality, and cost. But you can only have 2 out of these 3." There seems to be a consensus that the same applies in regard to running an application. You need to pick two of the following:
- Very low latency
- Very high throughput
- Lowest resource usage (CPU and memory)
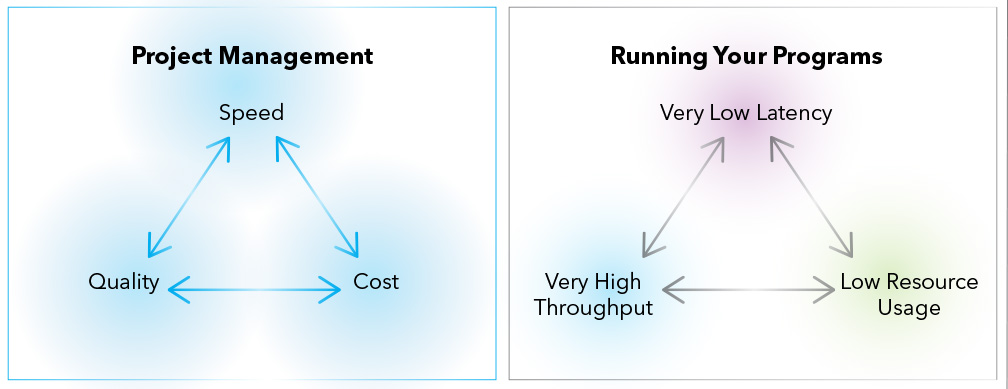
But there is actually a fourth element we should add here: "Good Engineering!" Azul Platform Prime is living proof that there is no need to make those trade-offs. Only one example is the concurrency in the C4 Garbage Collector, which is fundamentally more efficient compared to the traditional Stop-The-World GCs.
On top of that, Prime has a combination of technologies and tuning options that allow you to meet specific goals. The highly optimizing Falcon JIT compiler more than compensates for the overhead of "barriers" which are introduced into code to help concurrent GCs.
ReadyNow! and Connected Compilation help provide throughput without sacrificing too much warmup time and CPU. Prime GC continuously improves to find the best balance of the three goals.
About Concurrent Garbage Collectors
When the GC is concurrent, it shares the resources with application threads running concurrently. Thus the duration of the GC cycle can be impacted by the level of CPU load on the system or inside a container. A Stop-The-World GC does not face this issue since it stops all the Java threads when it runs.
Thus if the system is highly saturated, a concurrent GC can take significant time and introduce allocation pauses. To reap full benefit from concurrent GC, it is advisable to keep the CPU load average below the number of cores available. Of course, the eventual GC behavior will depend on a combination of factors – live set, allocation rate, and CPU load average.
Throughput Under Service Level Expectation
Azul Platform Prime helps achieve high “useful capacity” – the amount of load carried while maintaining reasonable service level expectations. As described before, the choice of garbage collector influences the responsiveness of the application.
Stop-the-world and partially concurrent collectors break response time targets at a much smaller load than Platform Prime’s garbage collector. The net result is that the cost of provisioning a cluster of nodes with response time expectations is often significantly lower on Prime.
More info regarding this topic is available in a blog post, Cassandra Performance: Throughput, Responsiveness, Capacity, and Cost.
Monitor Resource Usage for Optimal Garbage Collector Behaviour
VisualVM (provided in OpenJDK), Java Flight Recorder(OpenJDK and Azul), and the GC Log Analyzer (provided by Azul) are Java tools that can help you to identify potential memory leaks and keep an eye on the resources being used. On our documentation site, you can find more info on how to use these tools:
There is still much to learn
John Cuthbertson (Principal Engineer, C4 GC team)
Like with Just-In-Time compilation and other significant components of Java, there is still much to learn. Although the GC is a mature technology, we, as the developers of it, are always looking at the best solutions between implementation changes and how they impact the behavior of both the GC itself and the applications using it.
We always need to consider the “Butterfly effect.” A small change on one side can have a considerable effect somewhere else. Predicting what the effect will be of a change is always hard. That’s why so many people are working on the tuning of implementations in the Java Virtual Machine and documenting all the possible changes and their impact.
Learn More…
If you were asking, “What should I know about garbage collection,” this post gives an overview of the functionality of the Garbage Collector and the things a developer should know.
This is only a starting point, and there is a lot more you can learn to get a deeper understanding of this topic!
On the Azul documentation website, you can find more information related to the GC optimizations provided by Azul Zulu Prime on the following links:
- What To Expect When Evaluating Azul Platform Prime Performance: Garbage Collection
- Understanding Azul Zulu Prime JVM Garbage Collectors
- GC log file and GC Log File Analyzer
- Diagnosing Java Performance Problems with the GC Log Analyzer
Challenge: an excellent way to learn how memory leaks occur in a Java application is trying to cause them intentionally! StackOverflow describes these cases in a nice list.
You can also watch this talk by Gil Tene, one of the Azul founders and also an expert on this topic:
- February 03, 2023
- 12 min read
Frank Delporte is a Java Champion, Java Developer, Senior Technical Writer at Azul, Blogger, Author of "Java Programming for Raspberry Pi - A Hands-On Guide to Electronics and IoT Projects", and Open-Source Contributor for Pi4J, Lottie4J, MelodyMatrix,... Frank writes and talks about Java in business production environments, but also in places people don’t always expect it, on the Raspberry Pi, driving GPIO pins, rendering JavaFX UIs, and running on RISC-V single-board computers.


Comments (0)
No comments yet. Be the first.