Analyzing Dependencies in IntelliJ IDEA
- May 11, 2023
- 6 min read
If you're working on a real world project, you're probably using external dependencies.
You might need to analyze which dependencies your application uses.
For example, you may want to find out how a particular version of a dependency ended up in your application.
Let's take a look at how IntelliJ IDEA can help you to analyze dependencies.
Using the Dependency Analyzer
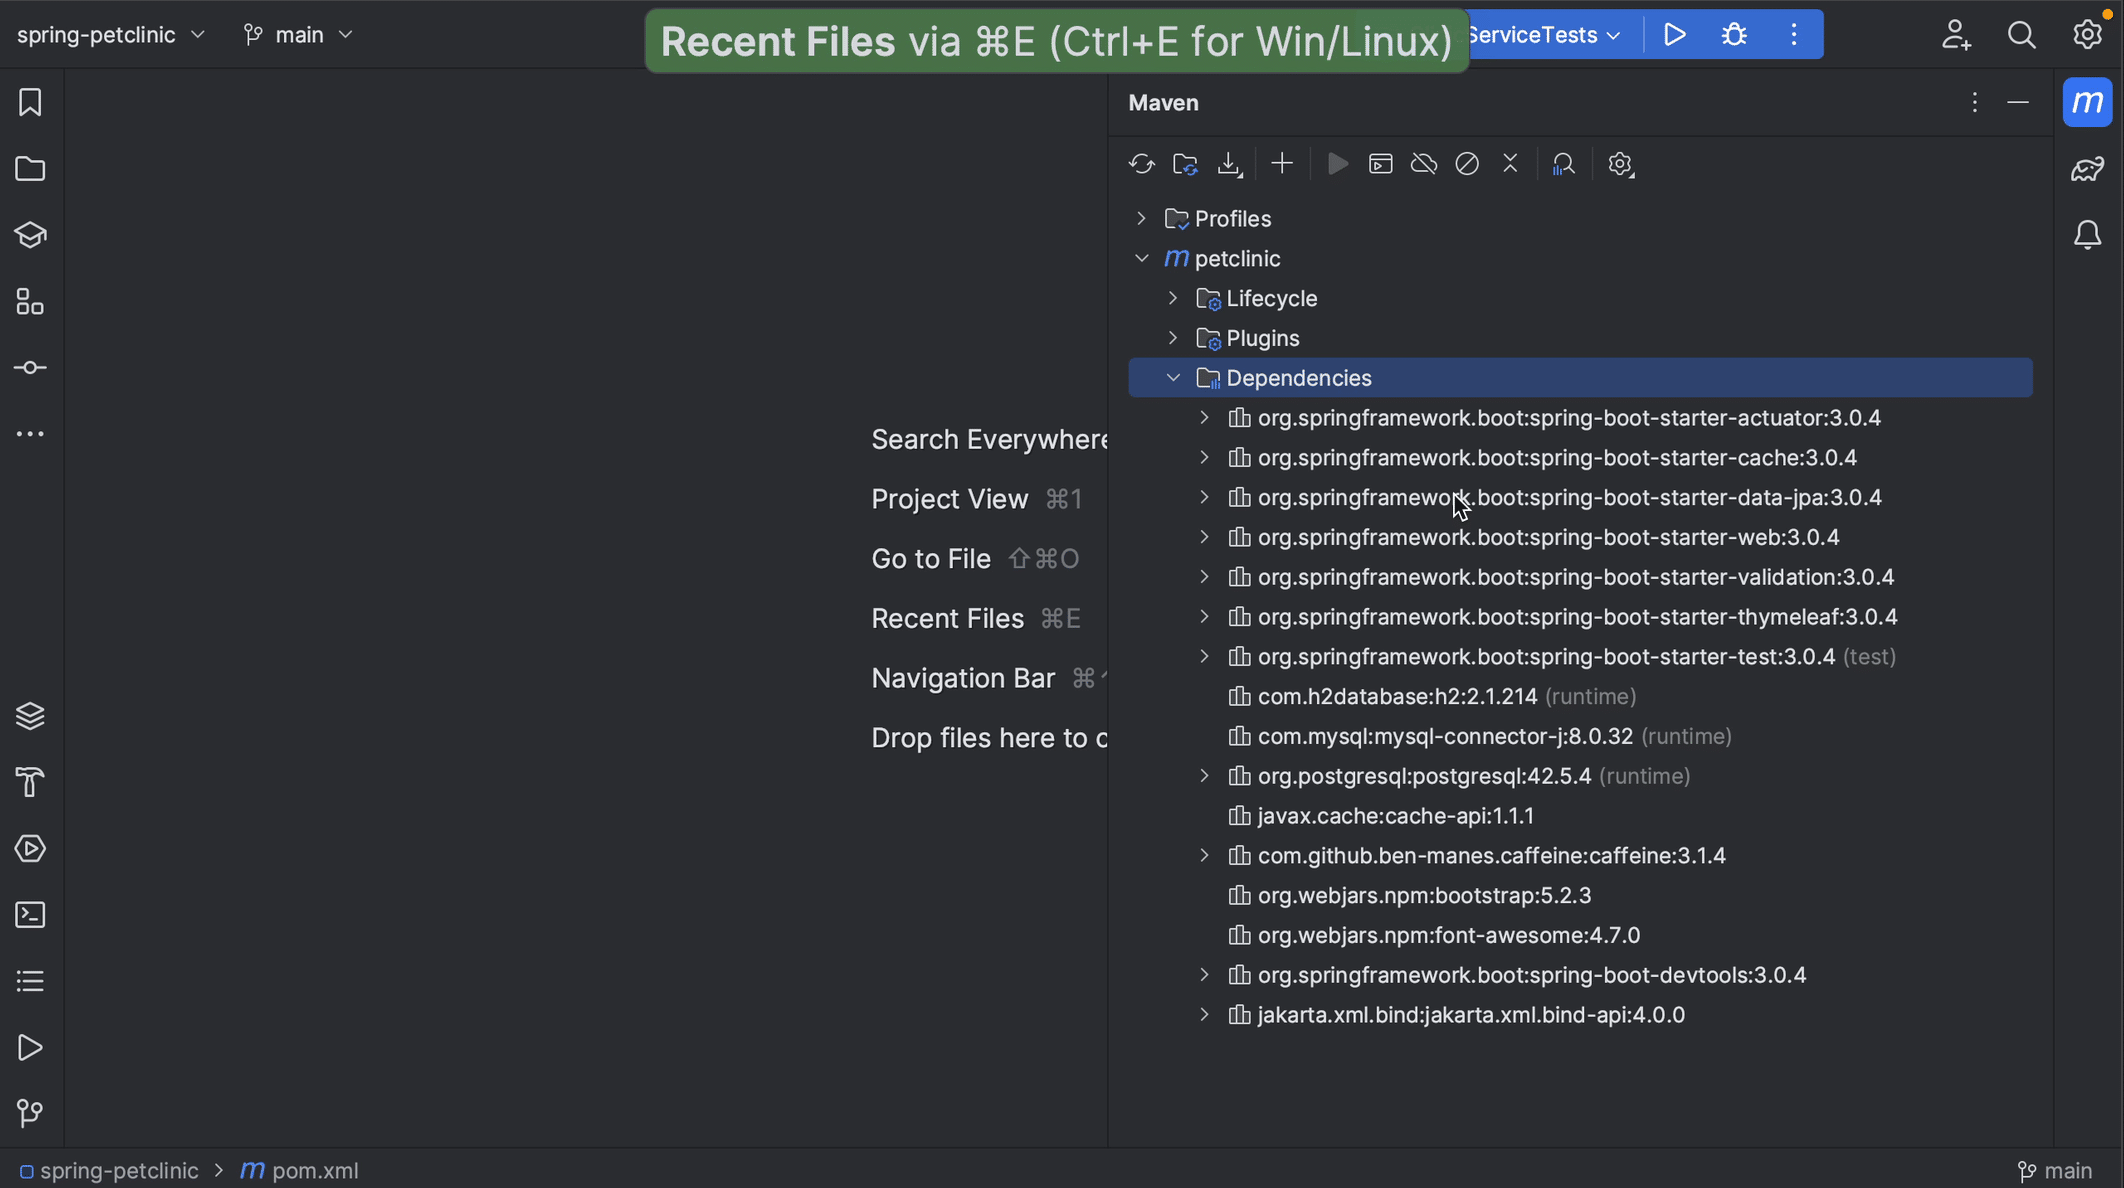
We can view our dependencies in the Maven or Gradle tool window.
Here, we can expand dependencies to show their transitive dependencies, or collapse them again.
Open the Dependency Analyzer
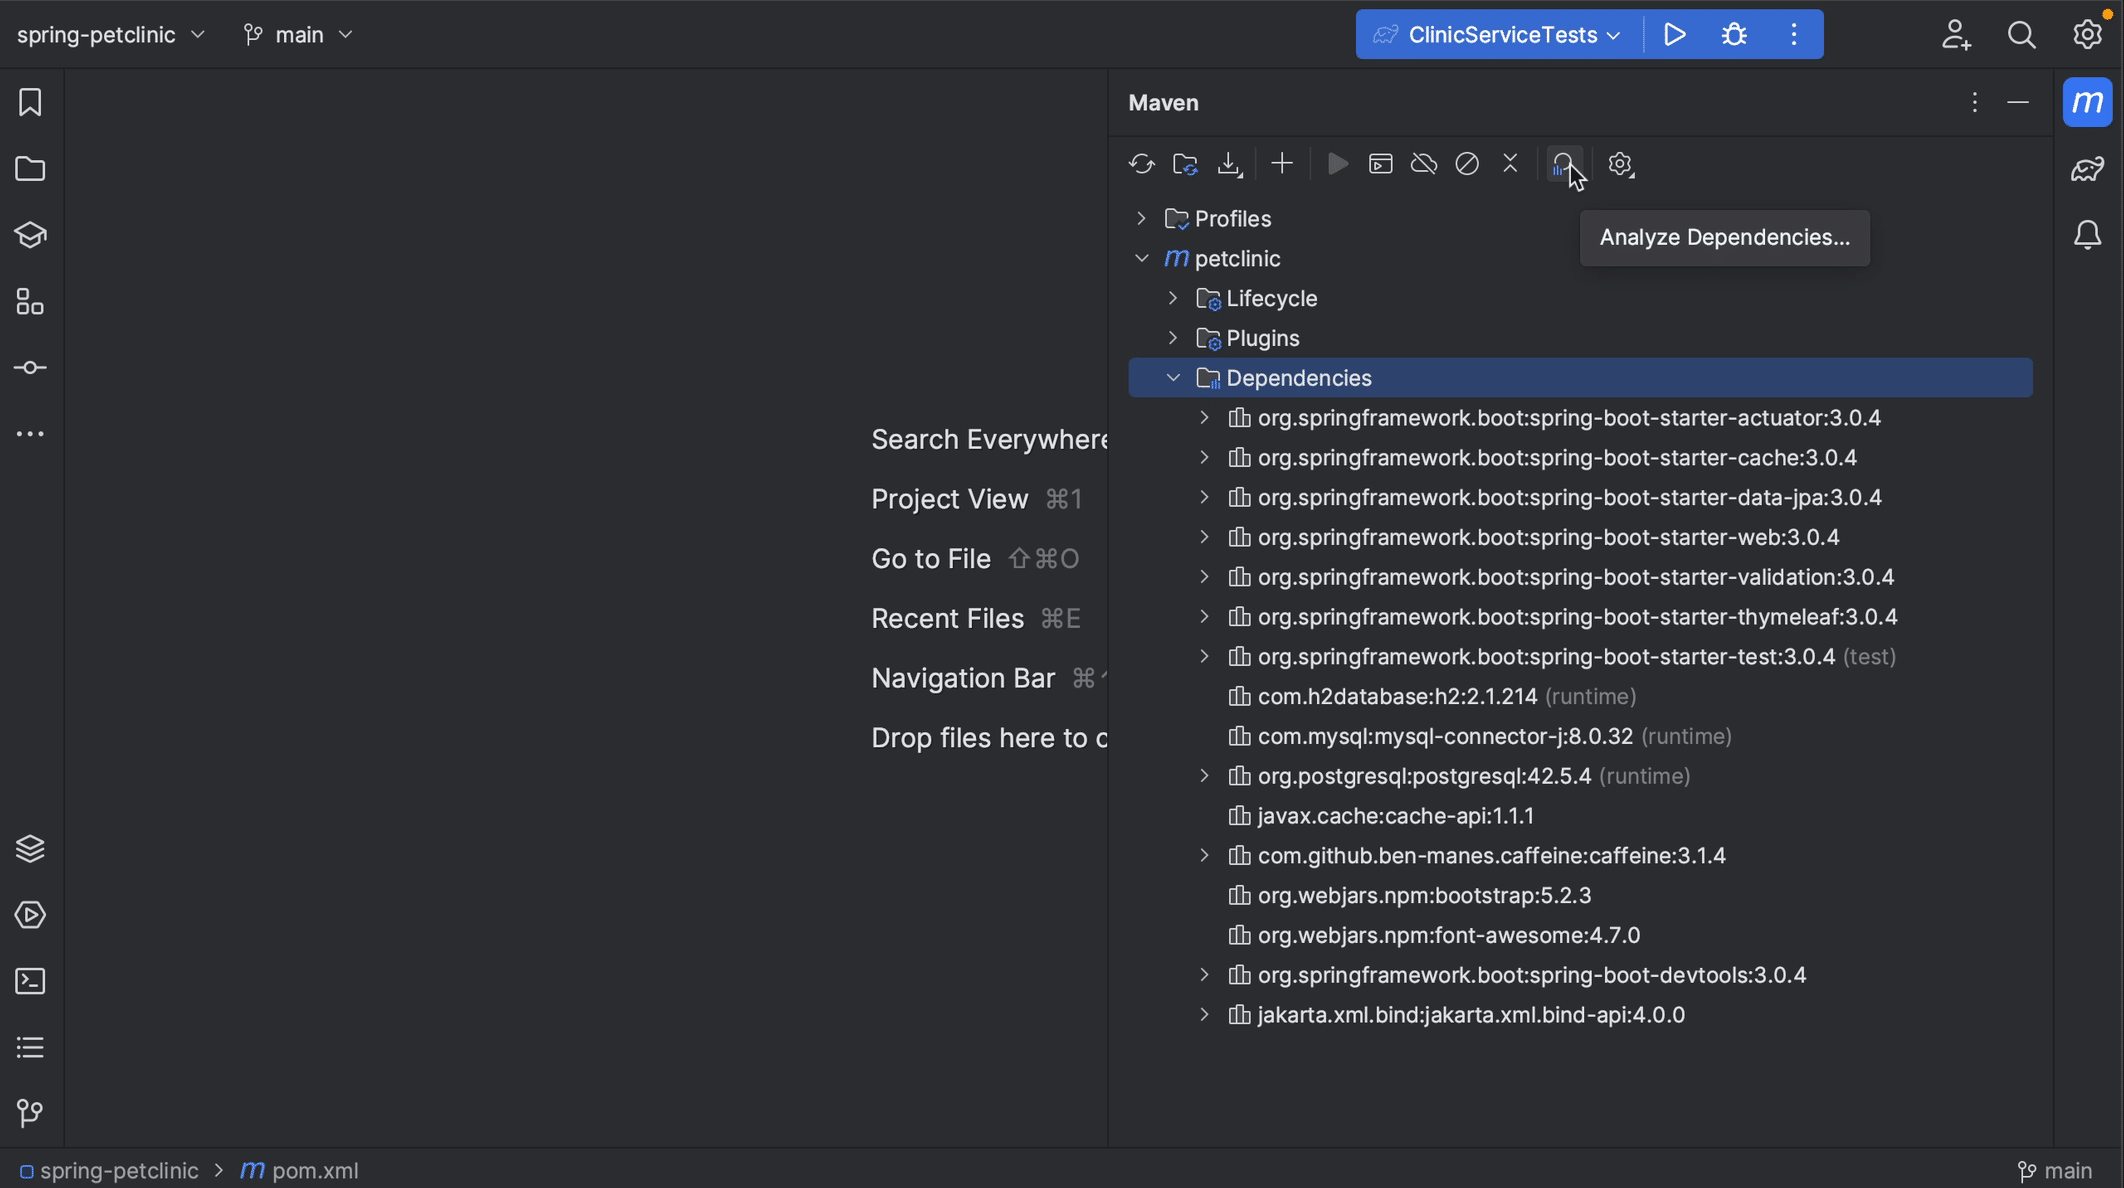
We can open the Dependency Analyzer from the Maven or Gradle tool window by clicking the Analyze Dependencies… button.
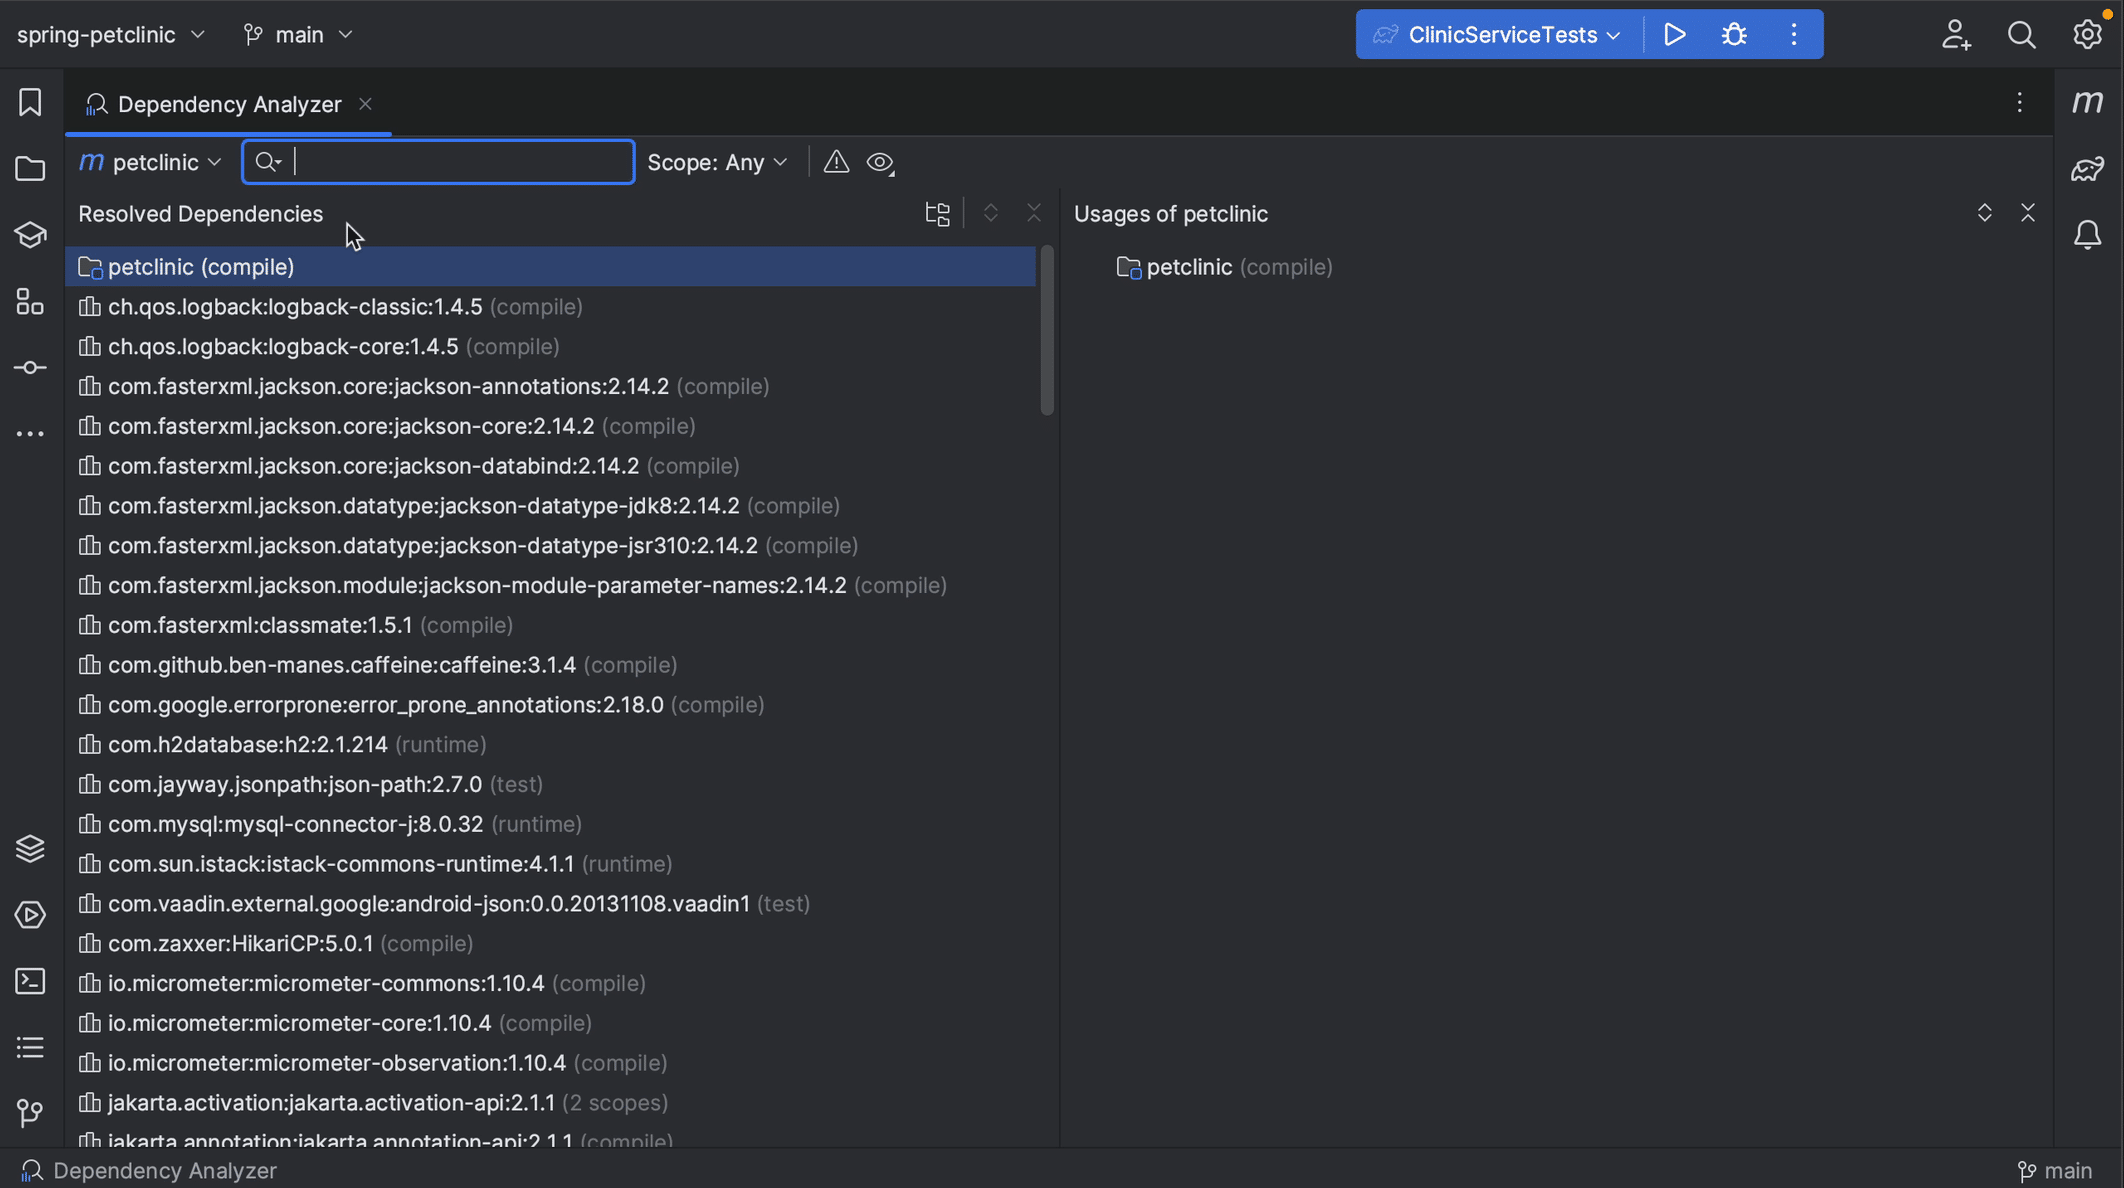
This will open the Dependency Analyzer showing the Resolved Dependencies on the left and their Usages on the right.
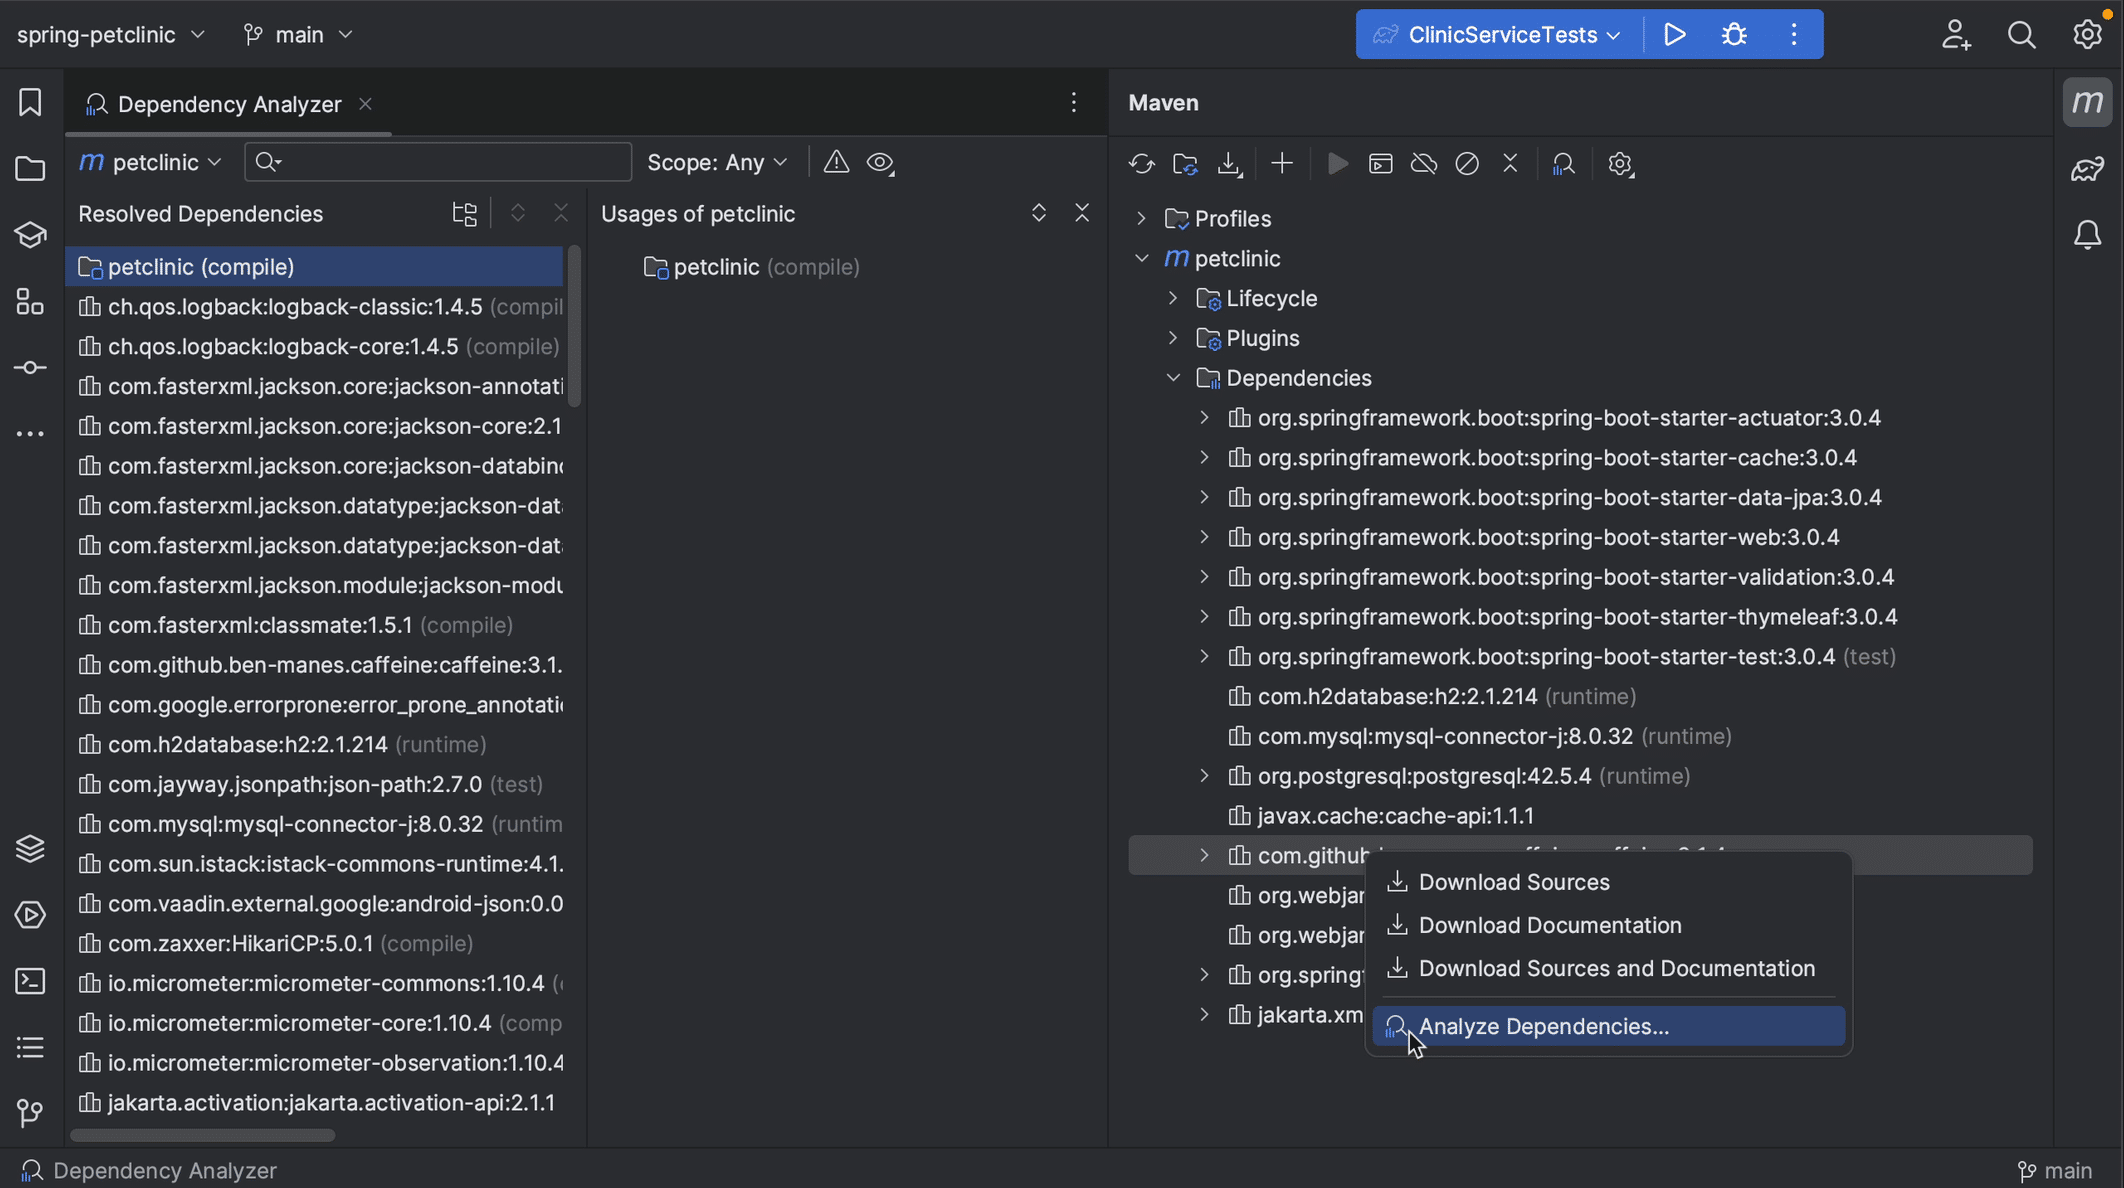
Alternatively, we can right-click a dependency in the Maven or Gradle tool window and select Analyze Dependencies from the context menu. This will open the Dependency Analyzer with the dependency selected.
We can hide all tool windows (⇧⌘F12 on macOS / Control+Shift+F12 on Windows/Linux), so we can focus on the dependencies.
Viewing dependencies in the Dependency Analyzer
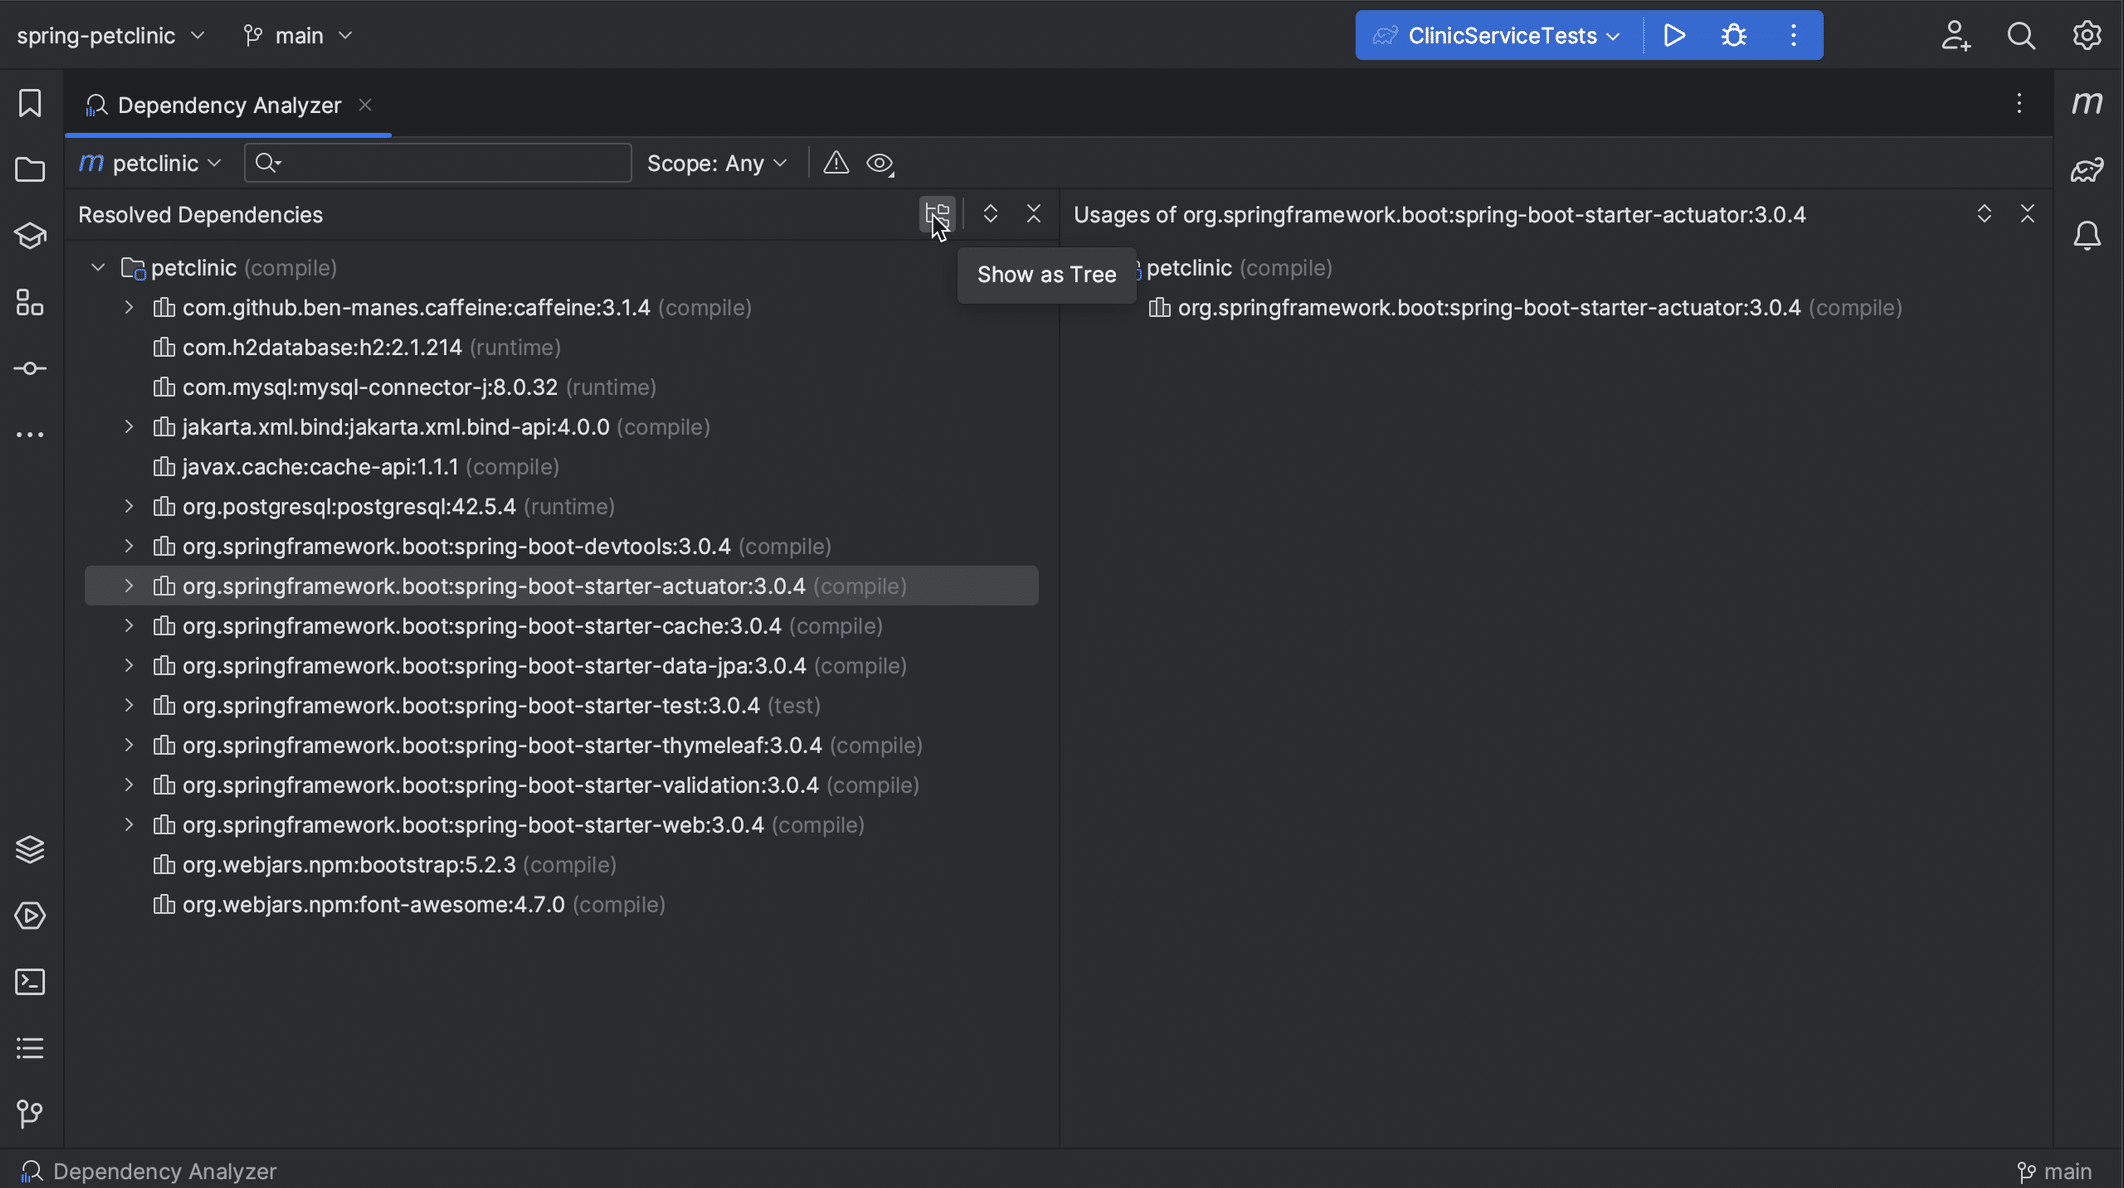
We can view the dependencies as a tree by clicking the Show as Tree button and Expand or Collapse them as needed by pressing the corresponding buttons.
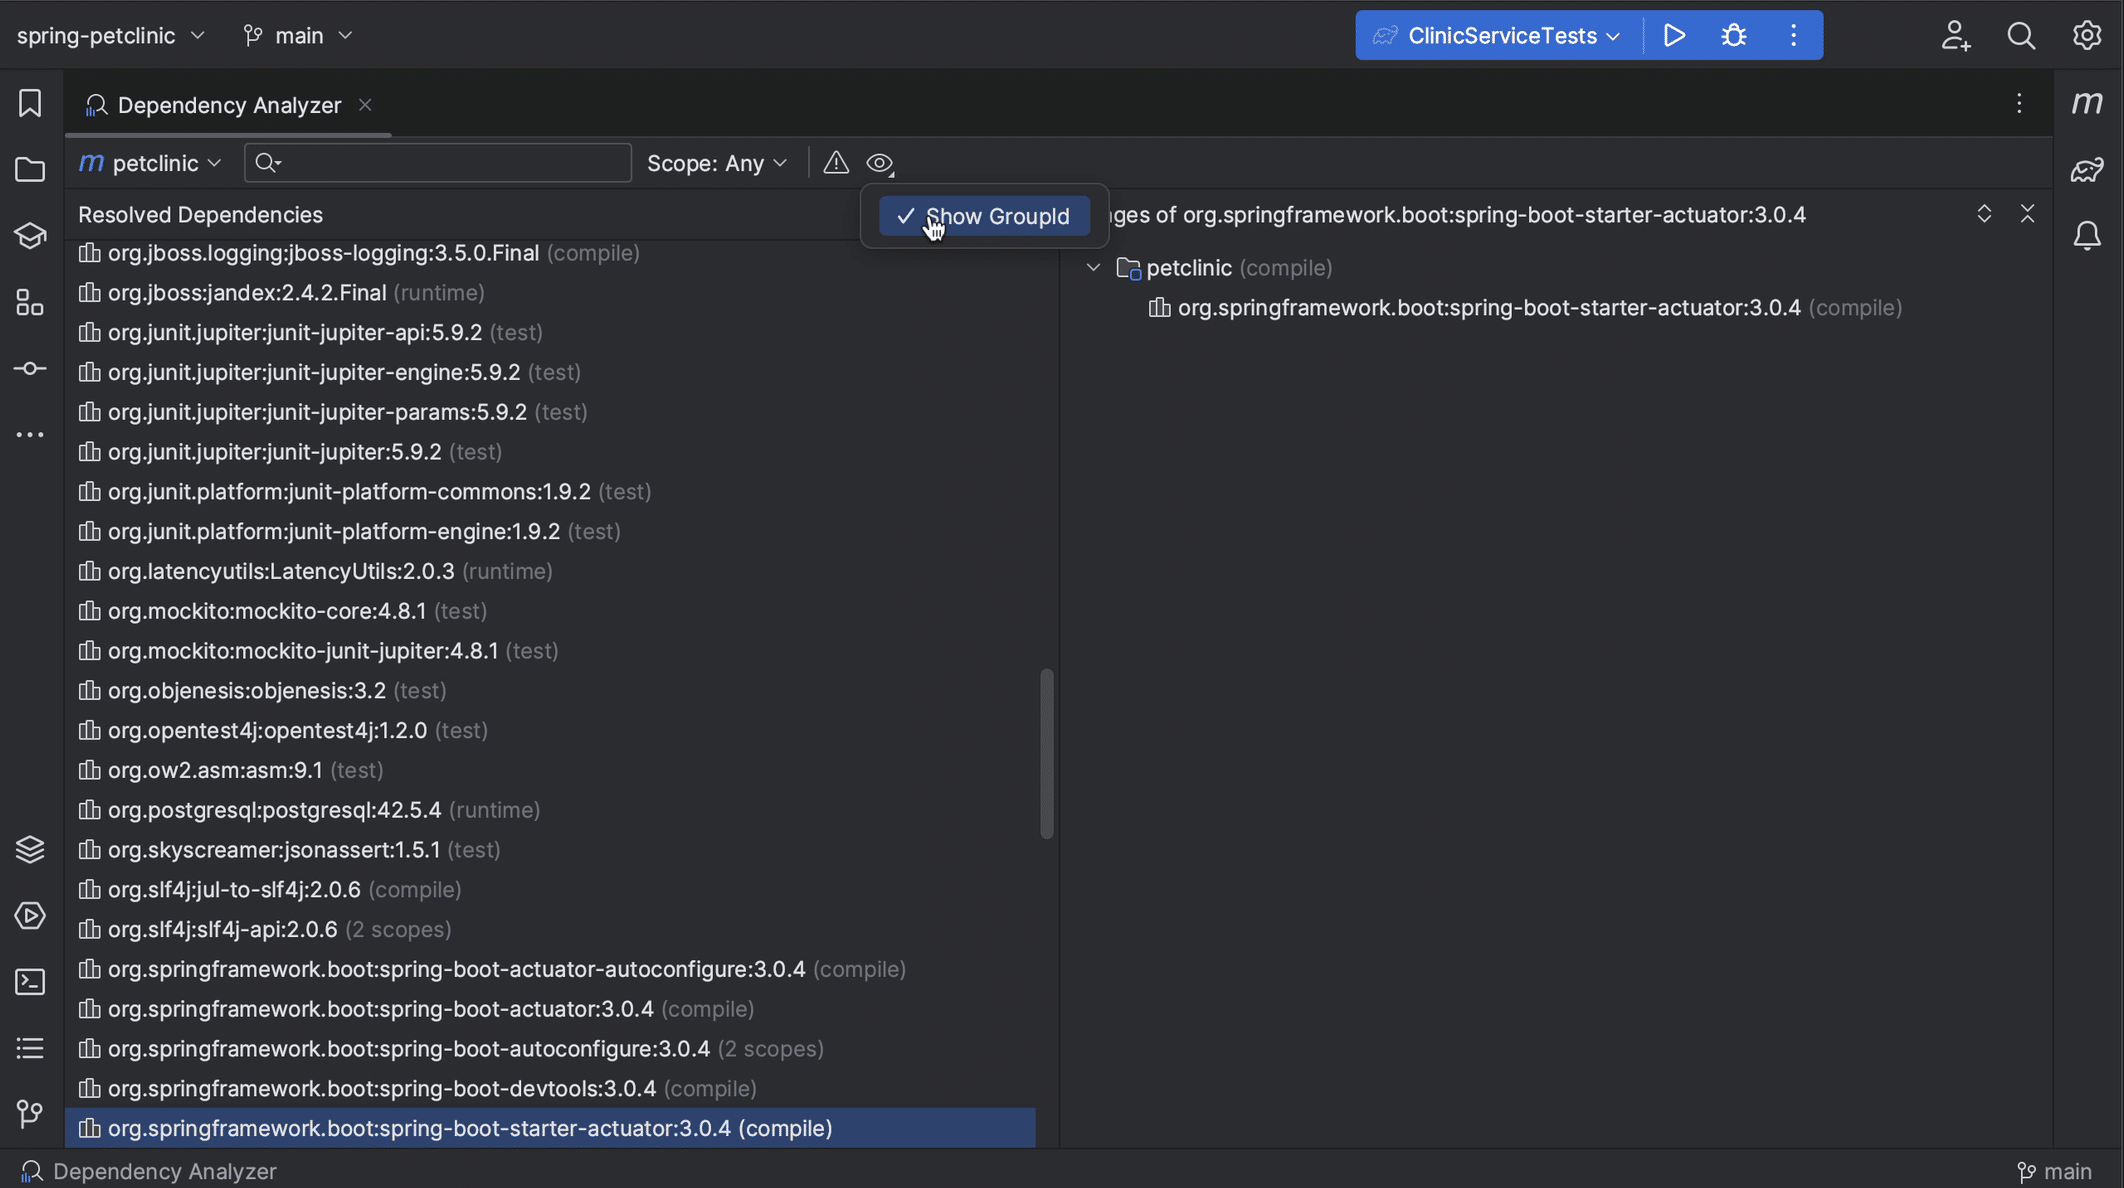
We can also click the View Options button and toggle Show GroupId, to show the GroupId for dependencies or not.
Finding a specific dependency
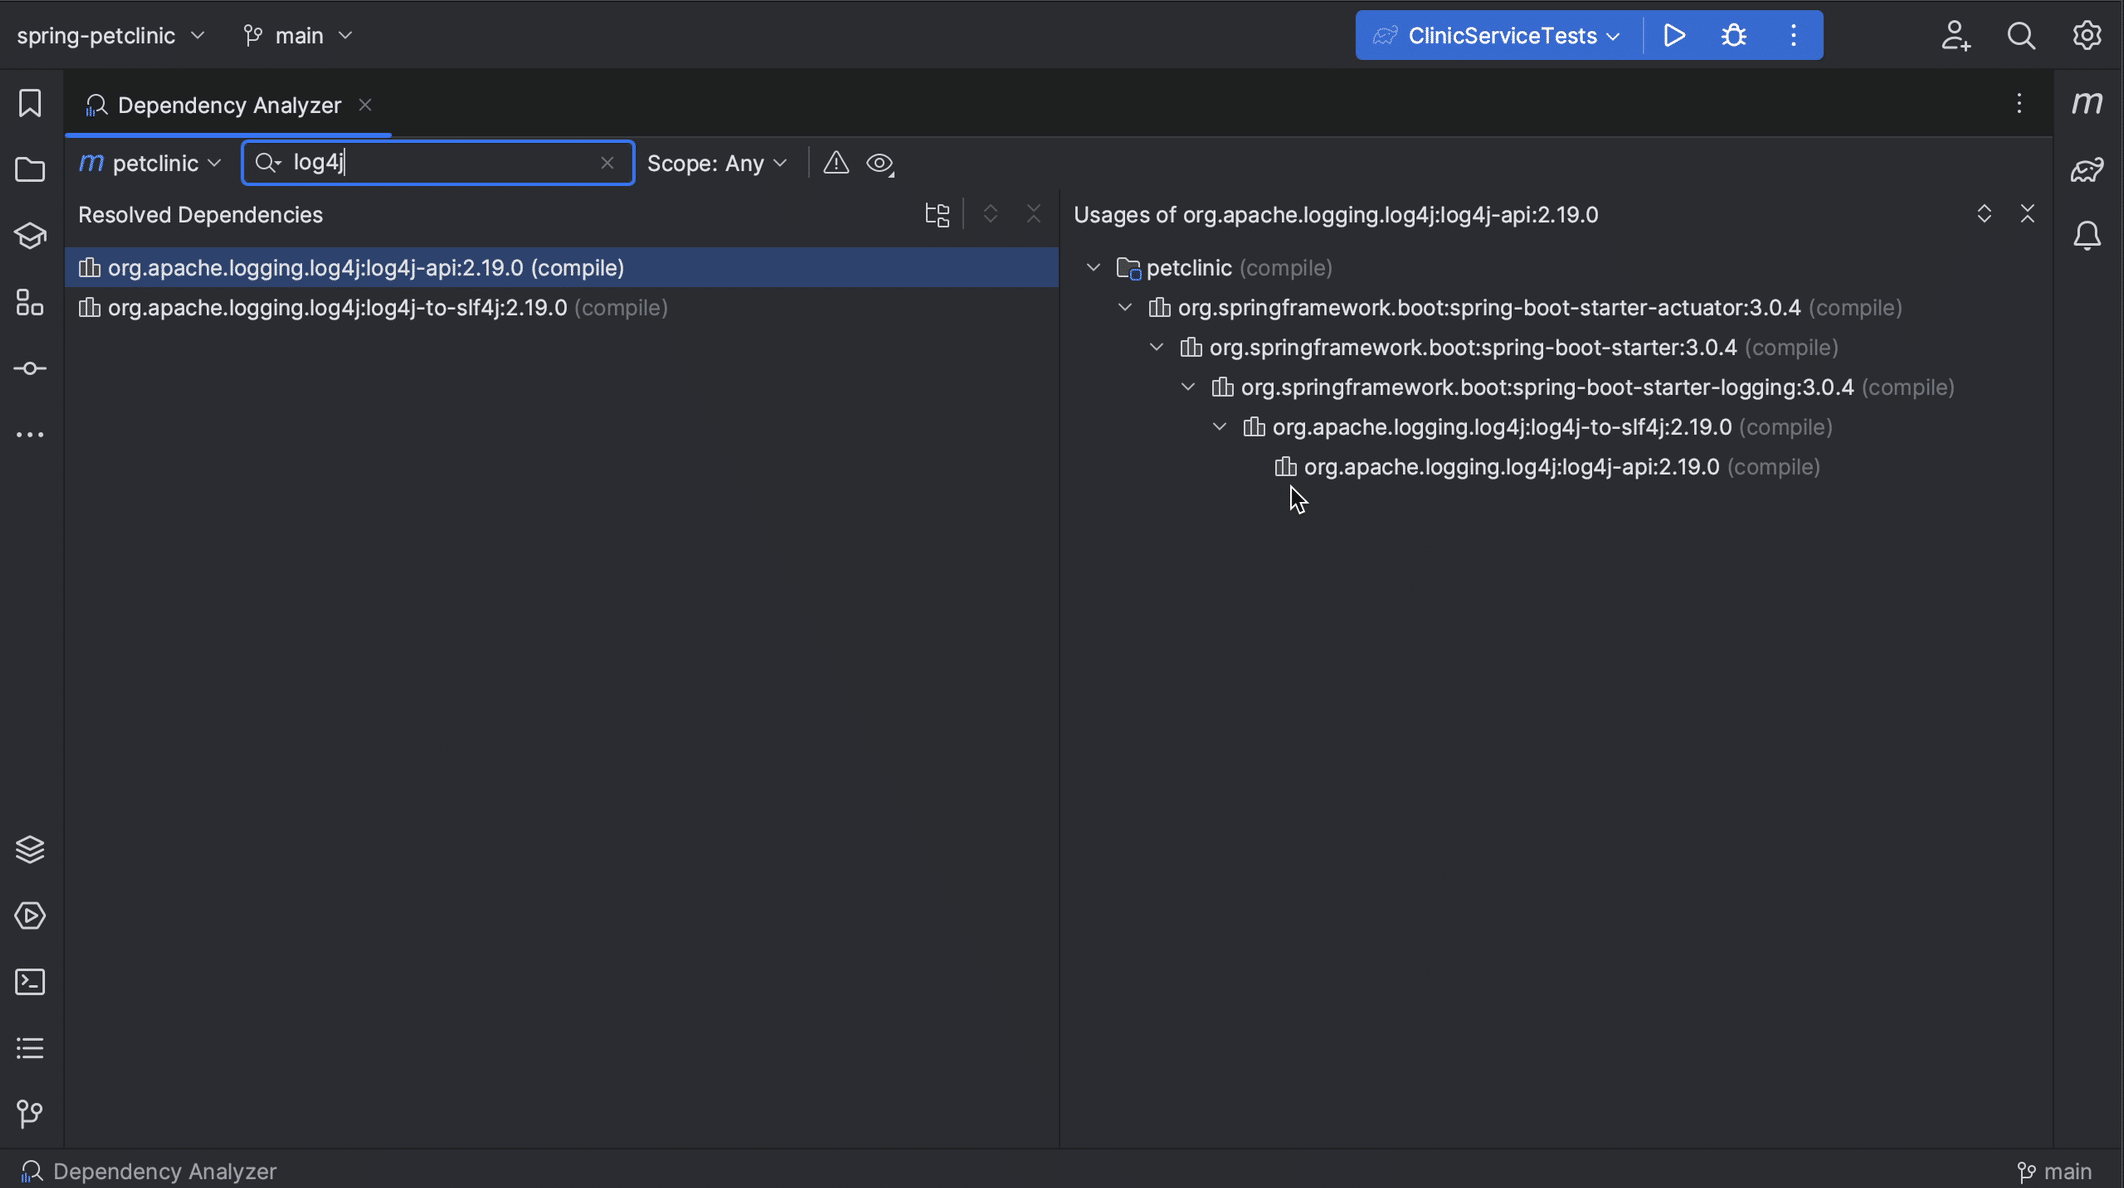
To see where we are getting a specific version of a particular library, we can search for that dependency. For example, when we search for "log4j" we see that we are only getting it via this spring-boot-starter, and it's a version newer than the one where log4shell was fixed.
Finding conflicts
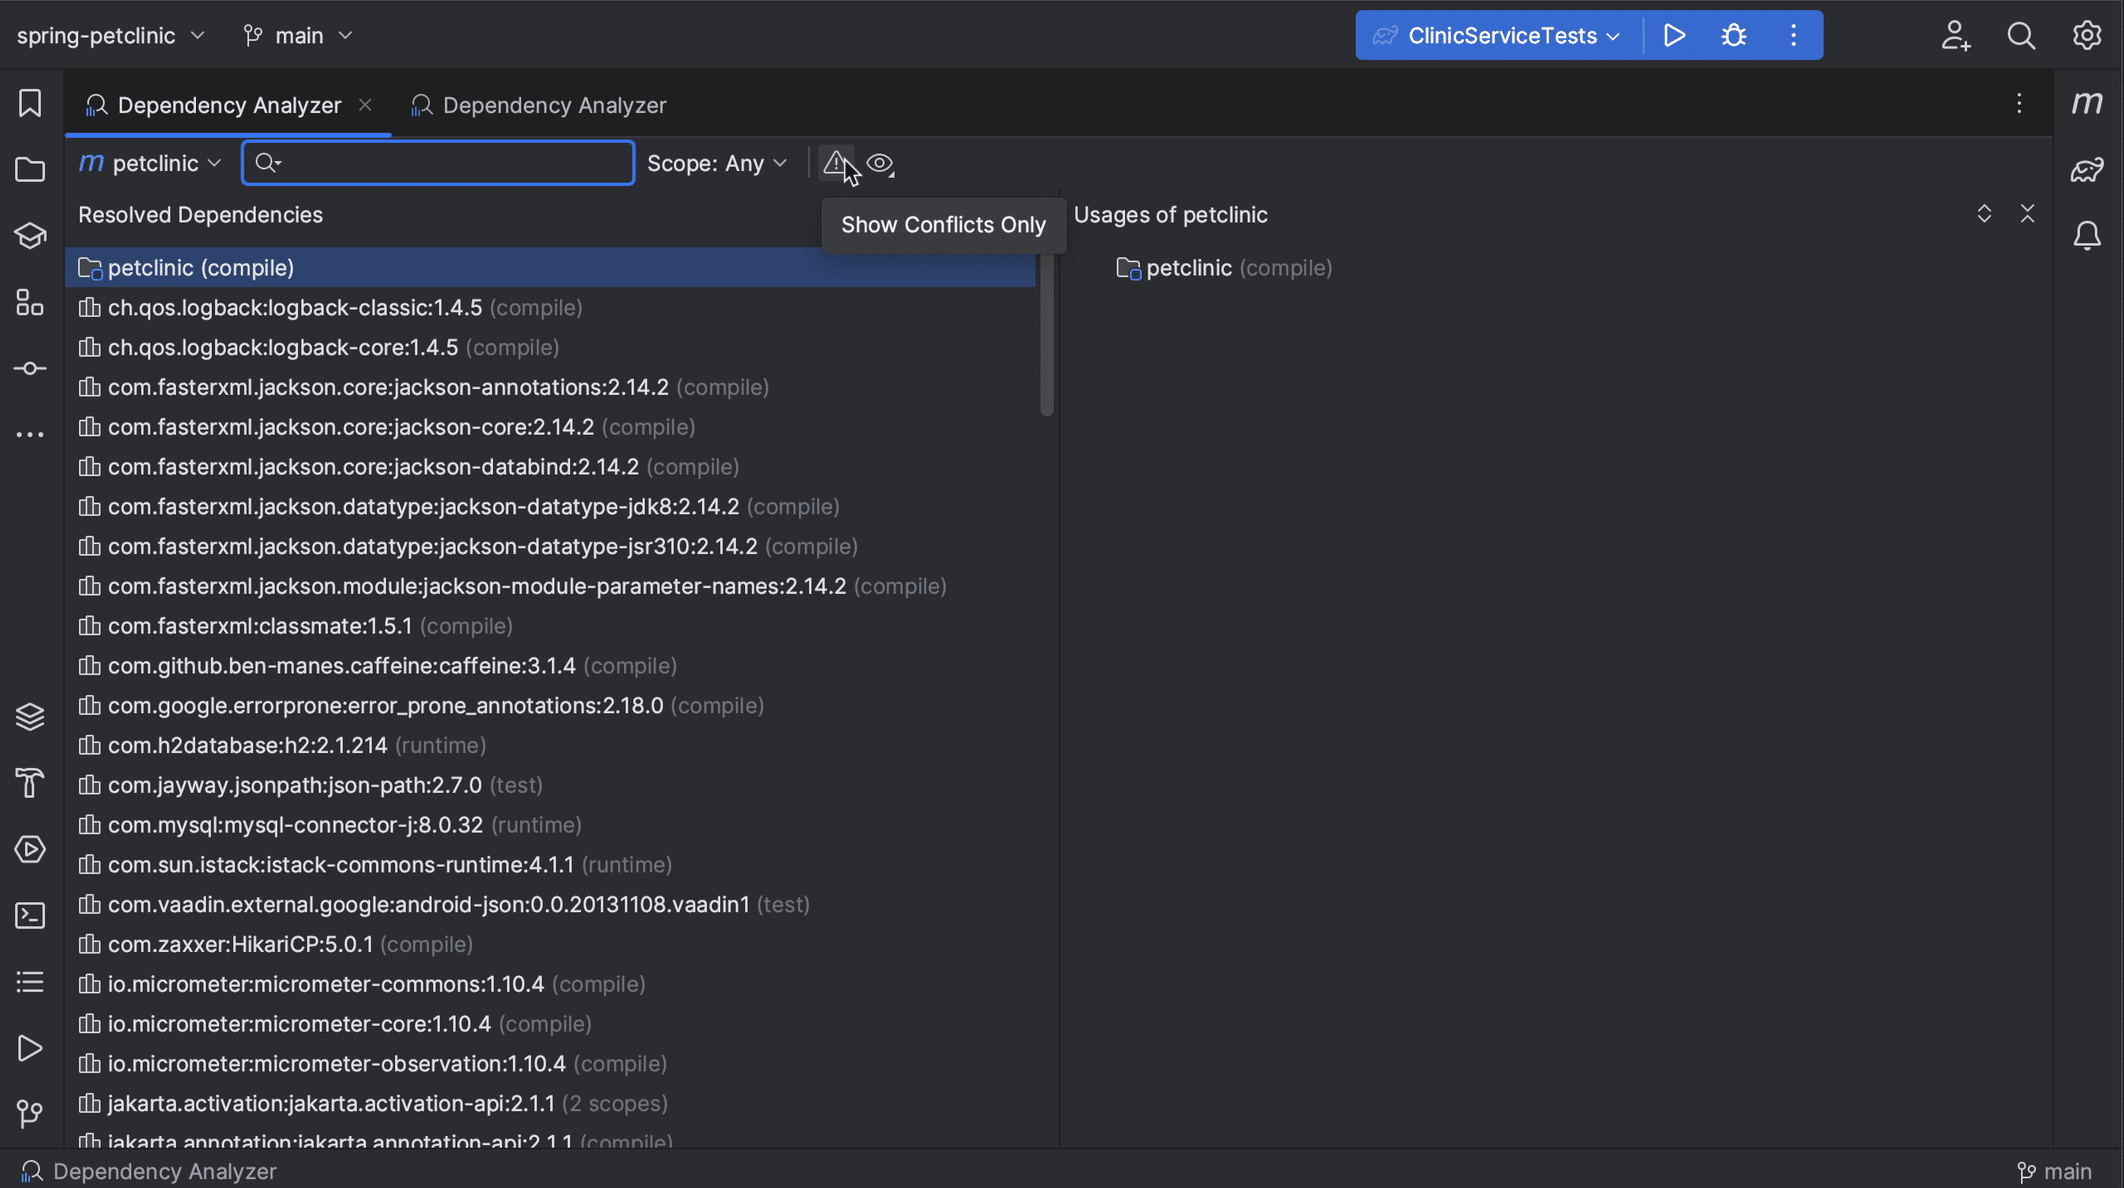
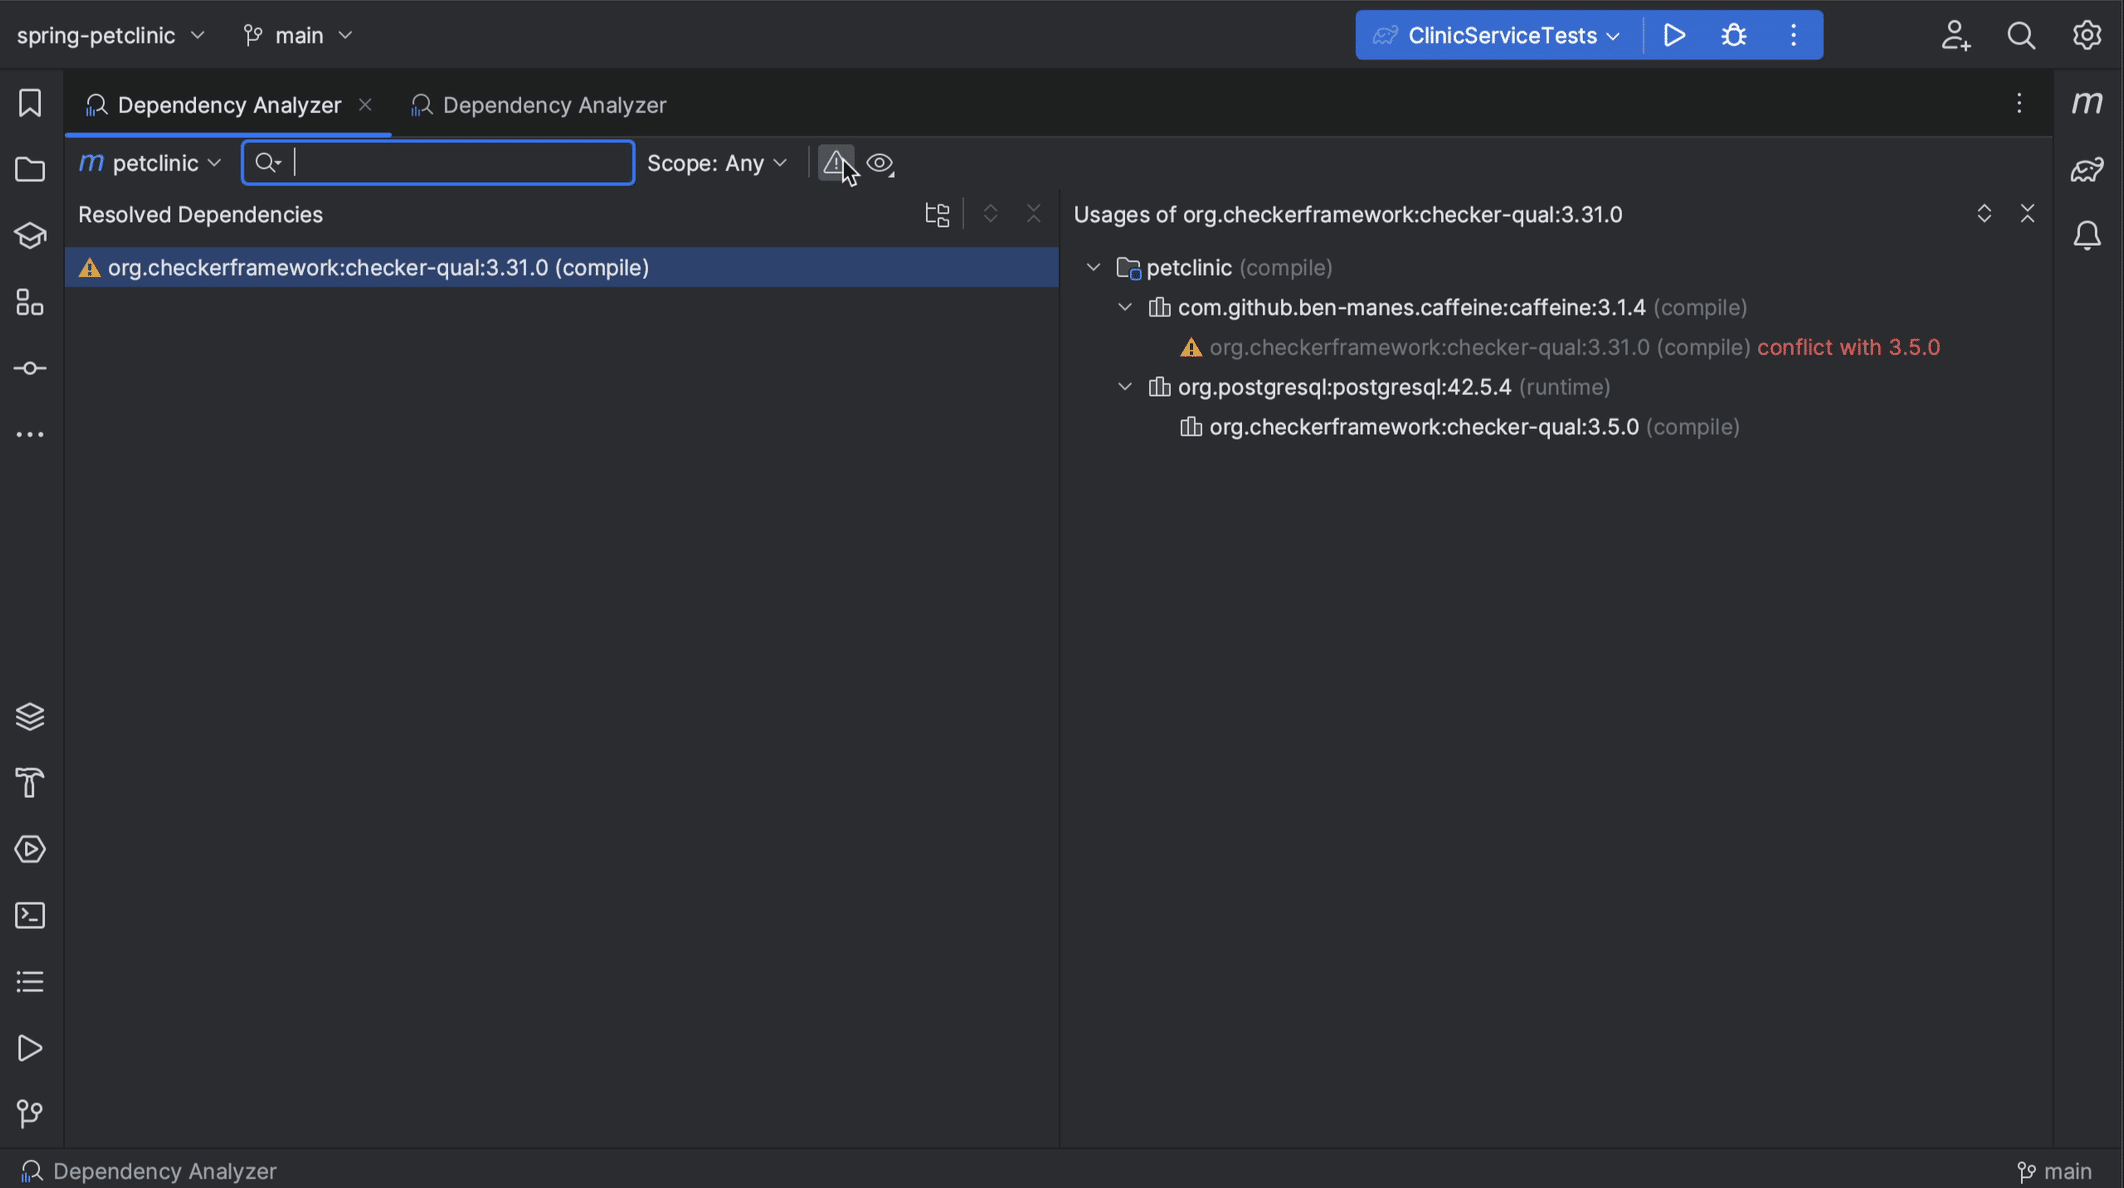
We might only want to look at dependencies that have conflicts. When we select the Show Conflicts Only button, we see only dependencies that have conflicts. In this example, we see that there is a conflict with the checker framework dependency.
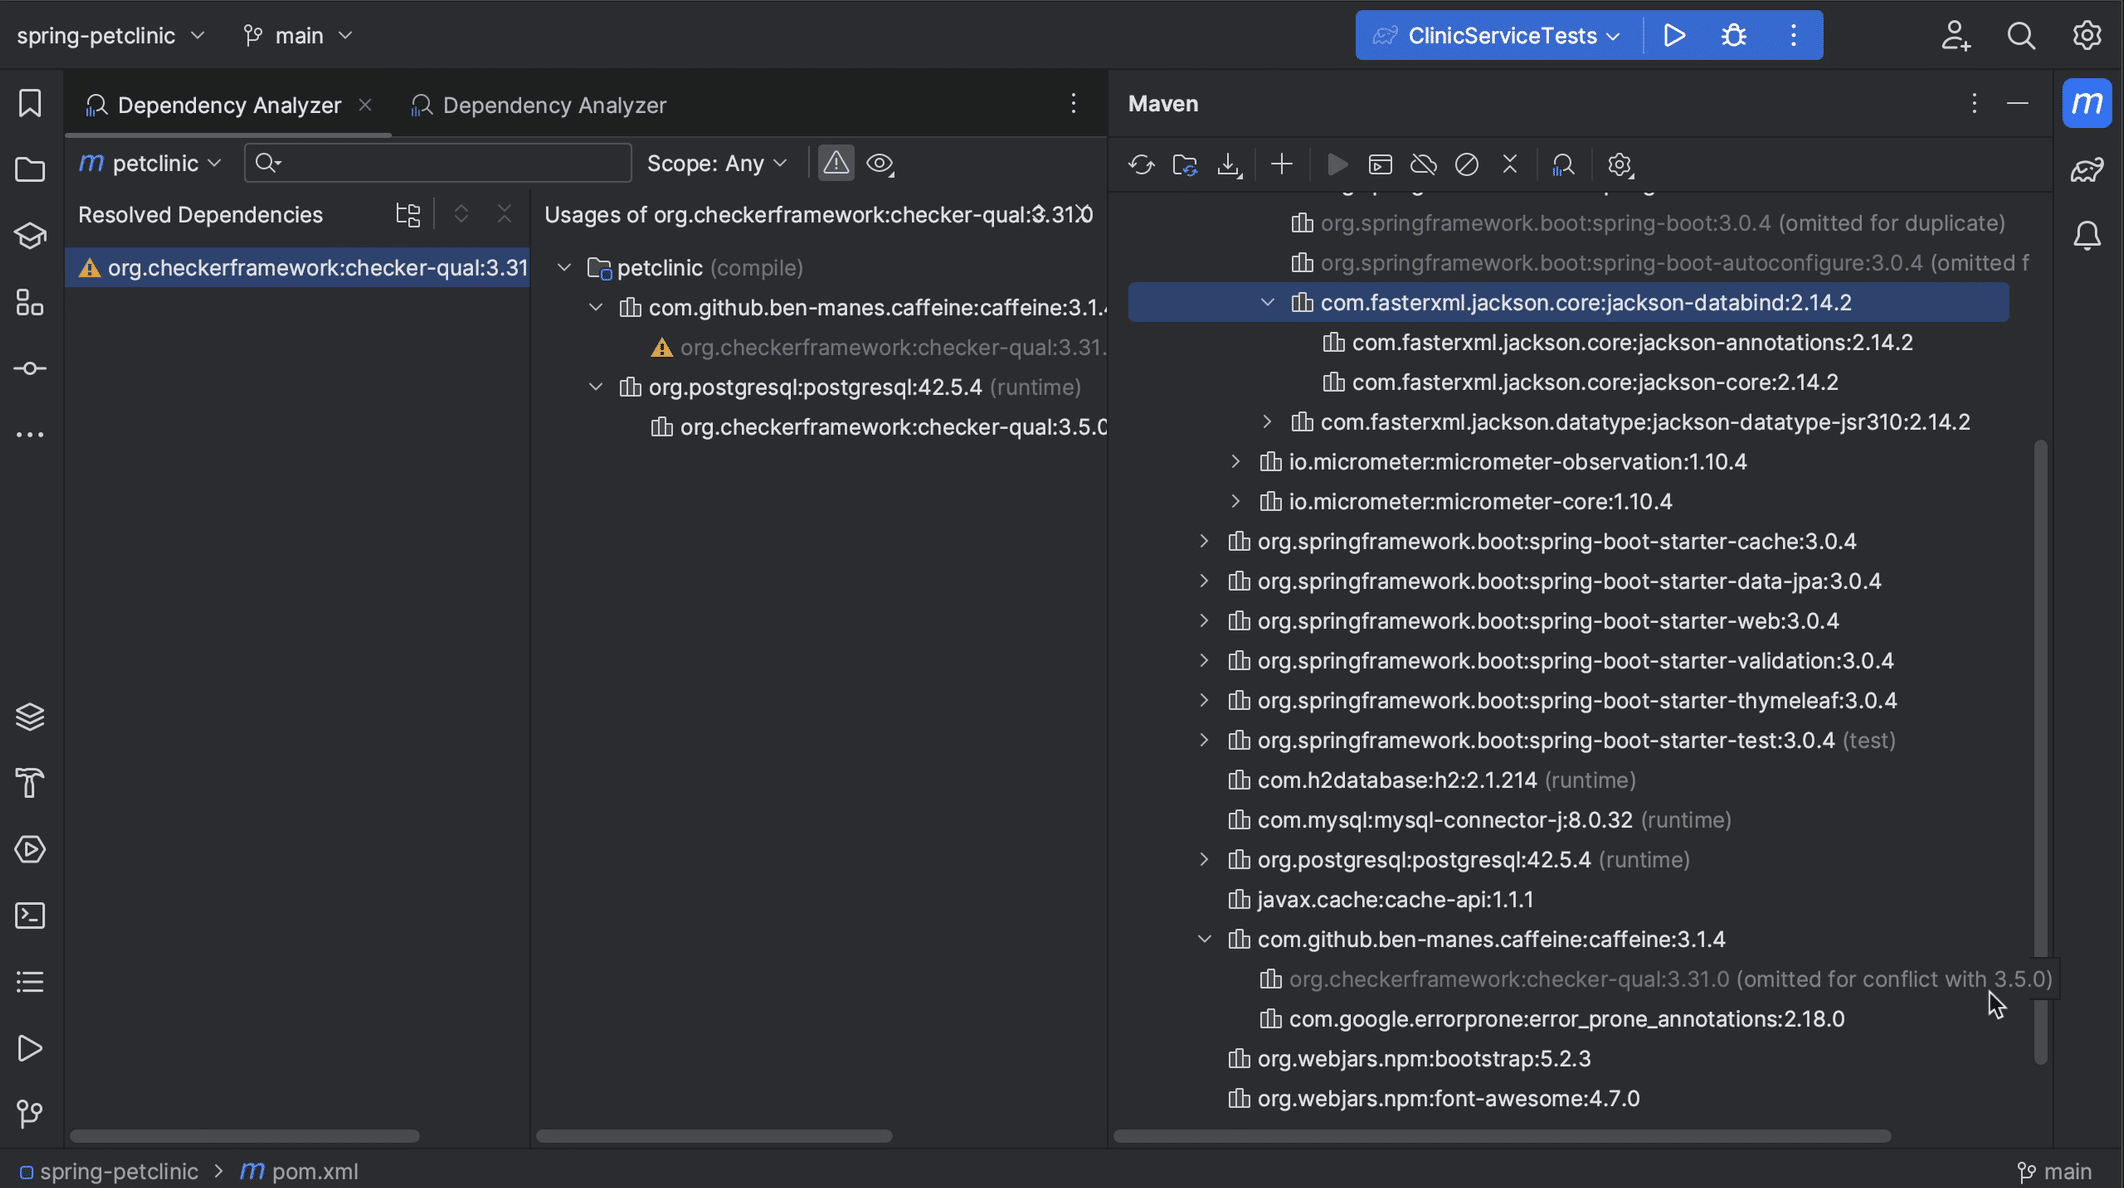
Fortunately, it's been resolved; we see that one version is greyed out. If we go back to the Maven tool window, we see that this version has been omitted for conflict. We can see that the version we are using is 3.5.0 which we get from postgres.
Selecting scopes
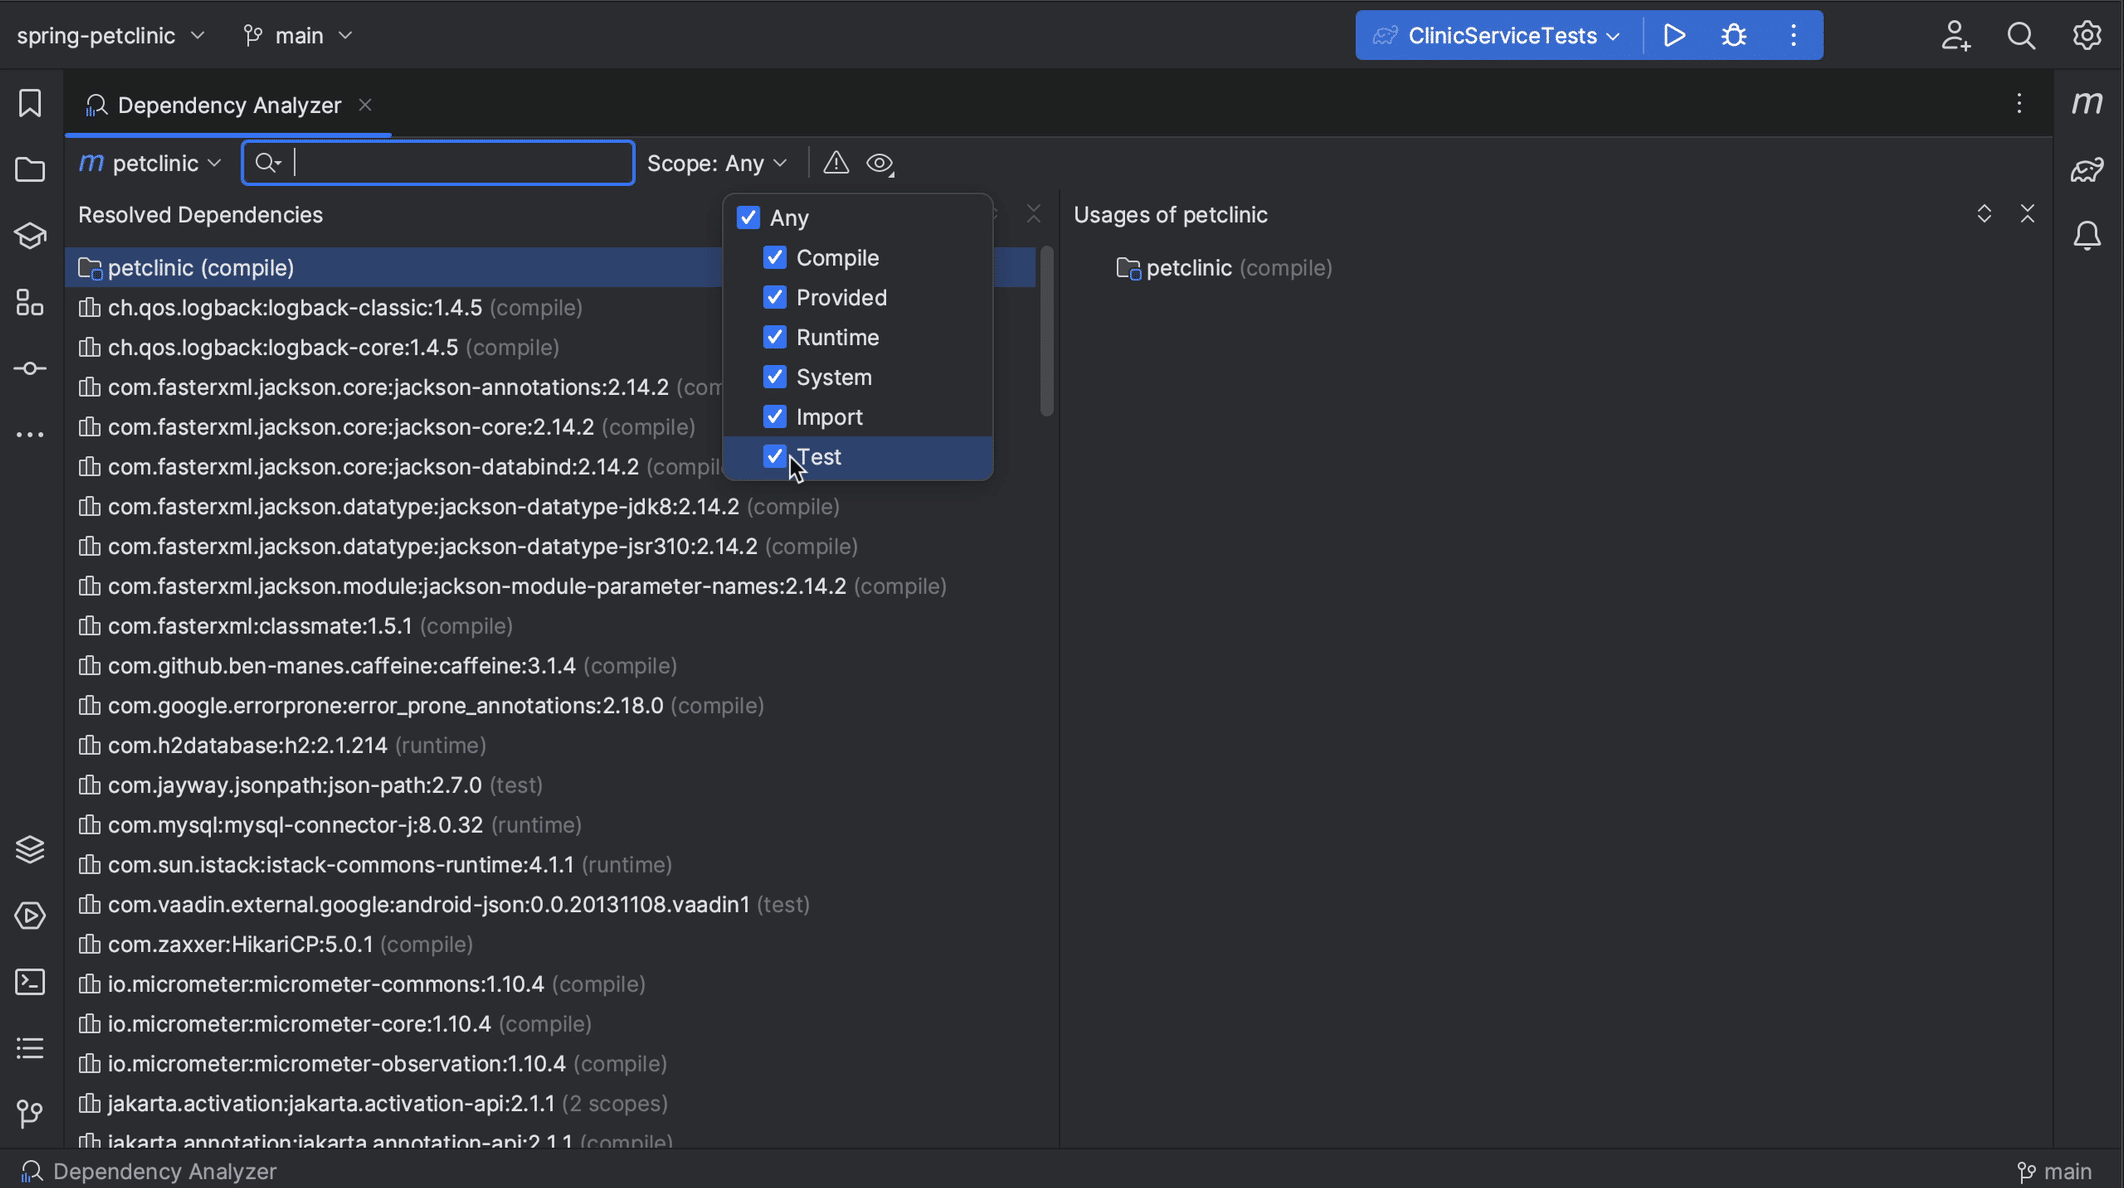
We can also select a scope (for example, if we want to look at our test dependencies or exclude them from analysis).
Since we've opened the Dependency Analyzer from the Maven tool window, we see the Maven scopes.
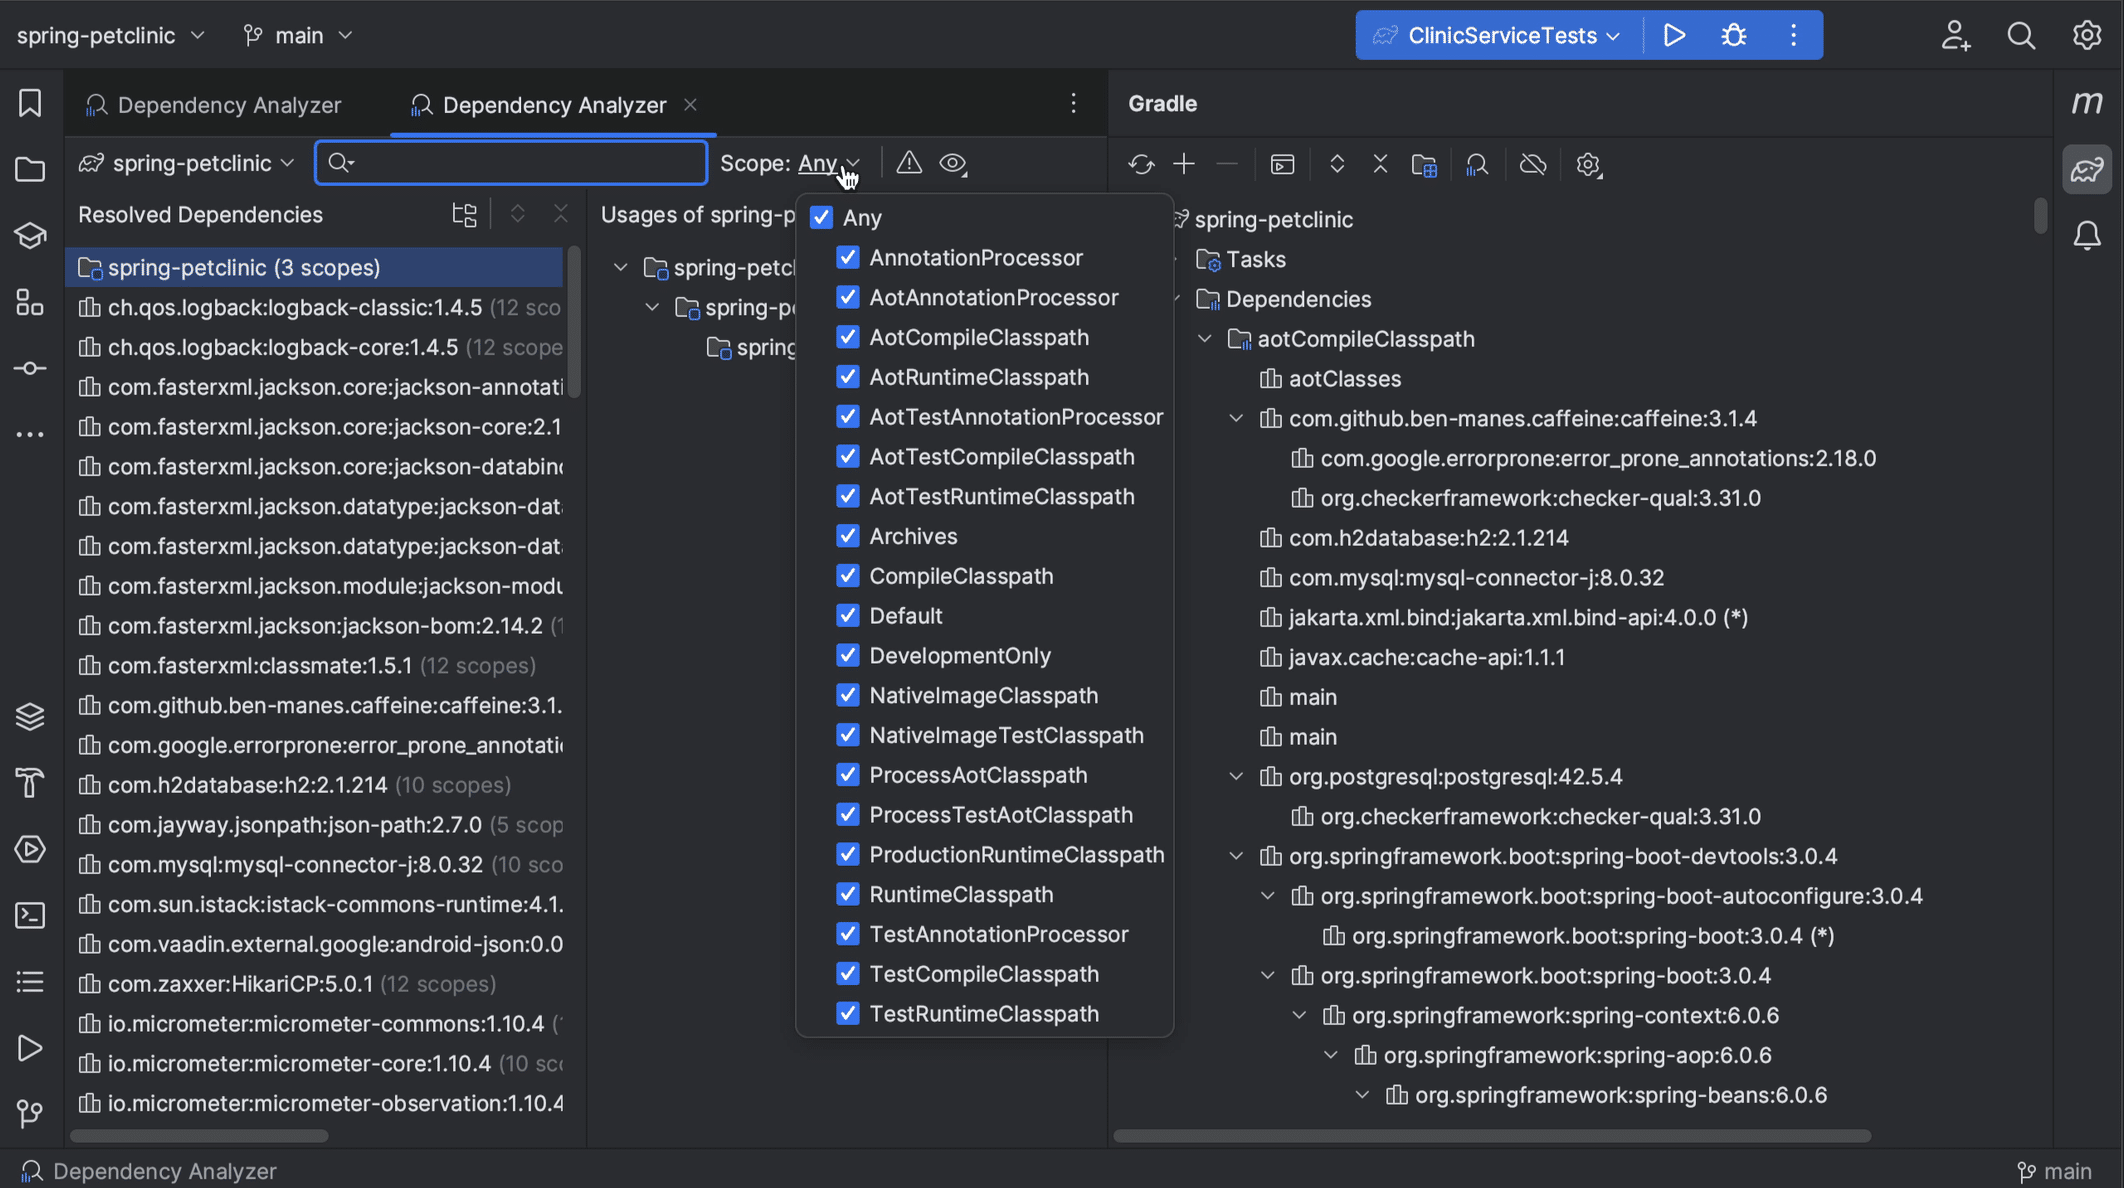
When we open the Dependency Analyzer from the Gradle tool window, the list of scopes will contain Gradle scopes.
More context
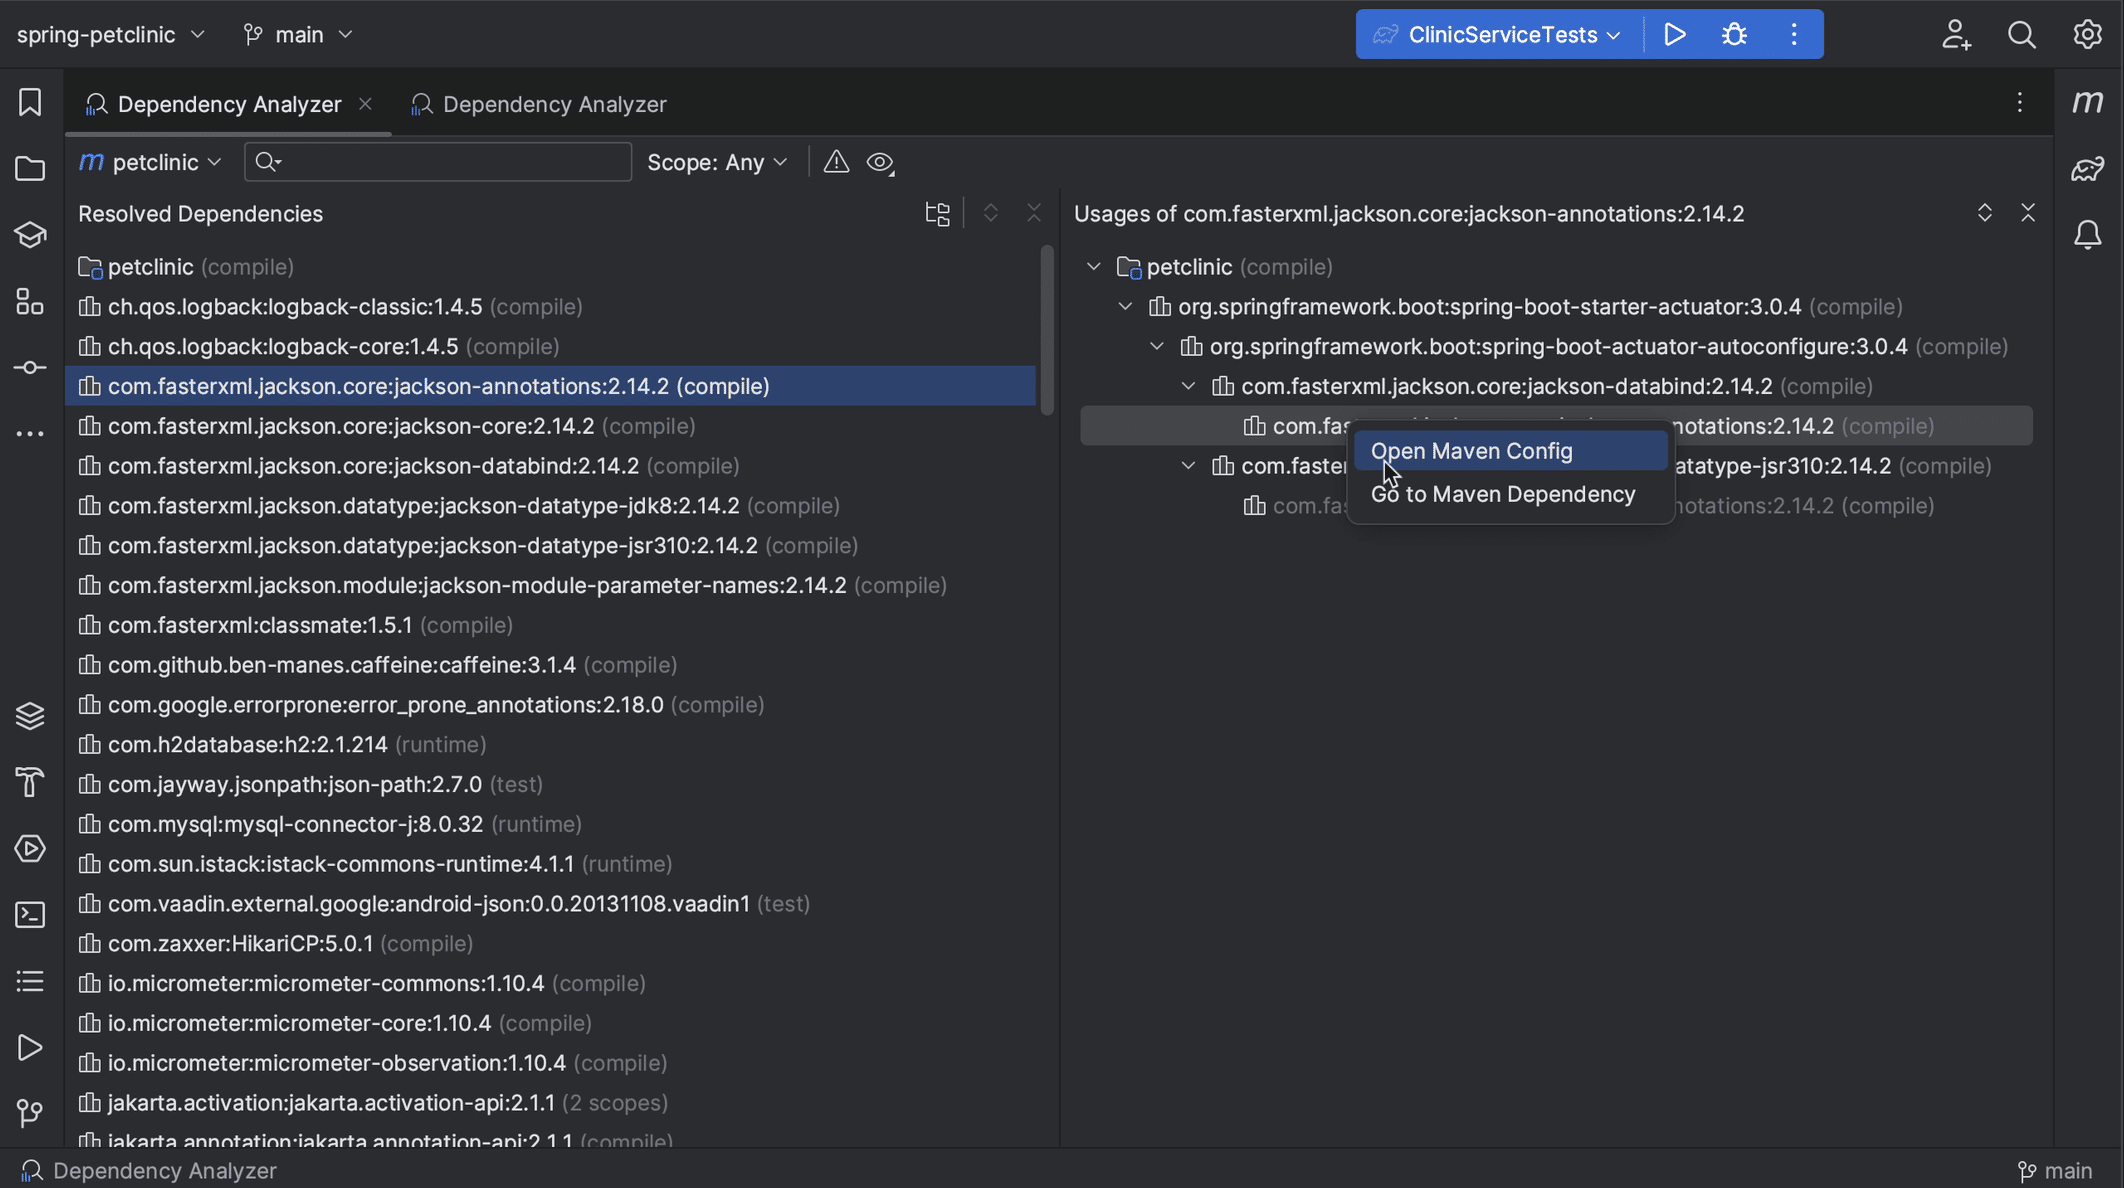
For more context, we can click a specific dependency and select Open Maven Config to open its pom.xml or Go to Maven Dependency to open the location in the pom.xml where this dependency is declared.
Using the Dependency Diagram
If you are using IntelliJ IDEA Ultimate, you can also view your dependencies as a diagram.
Show Diagrams
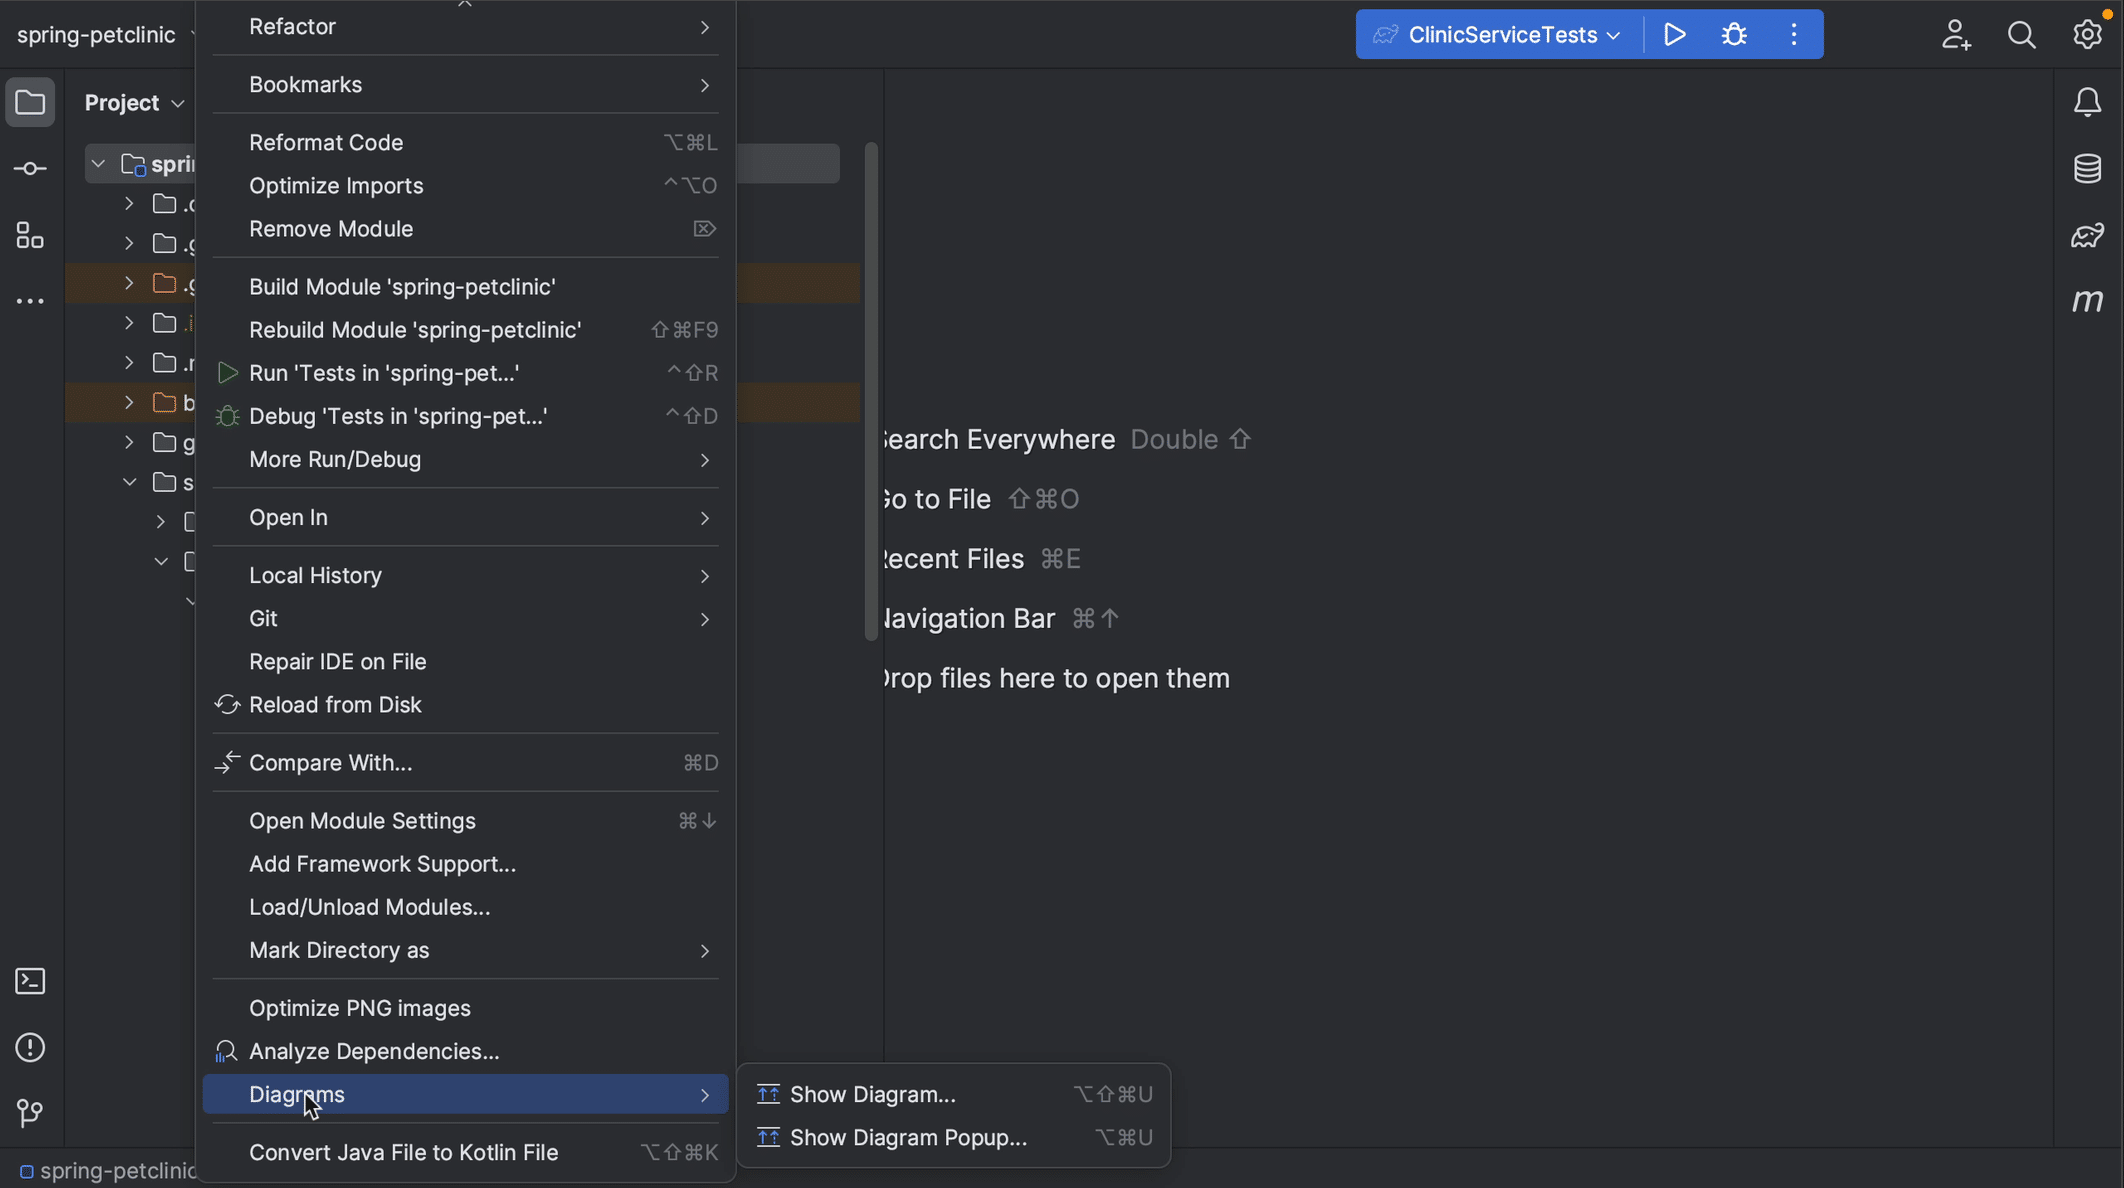
We can open diagrams either by right-clicking the project in the Project tool window and selecting Diagrams | Show Diagrams, or by using the shortcut ⌥ ⇧ ⌘ U (on macOS) or Ctrl+Alt+Shift+U (on Windows/Linux).
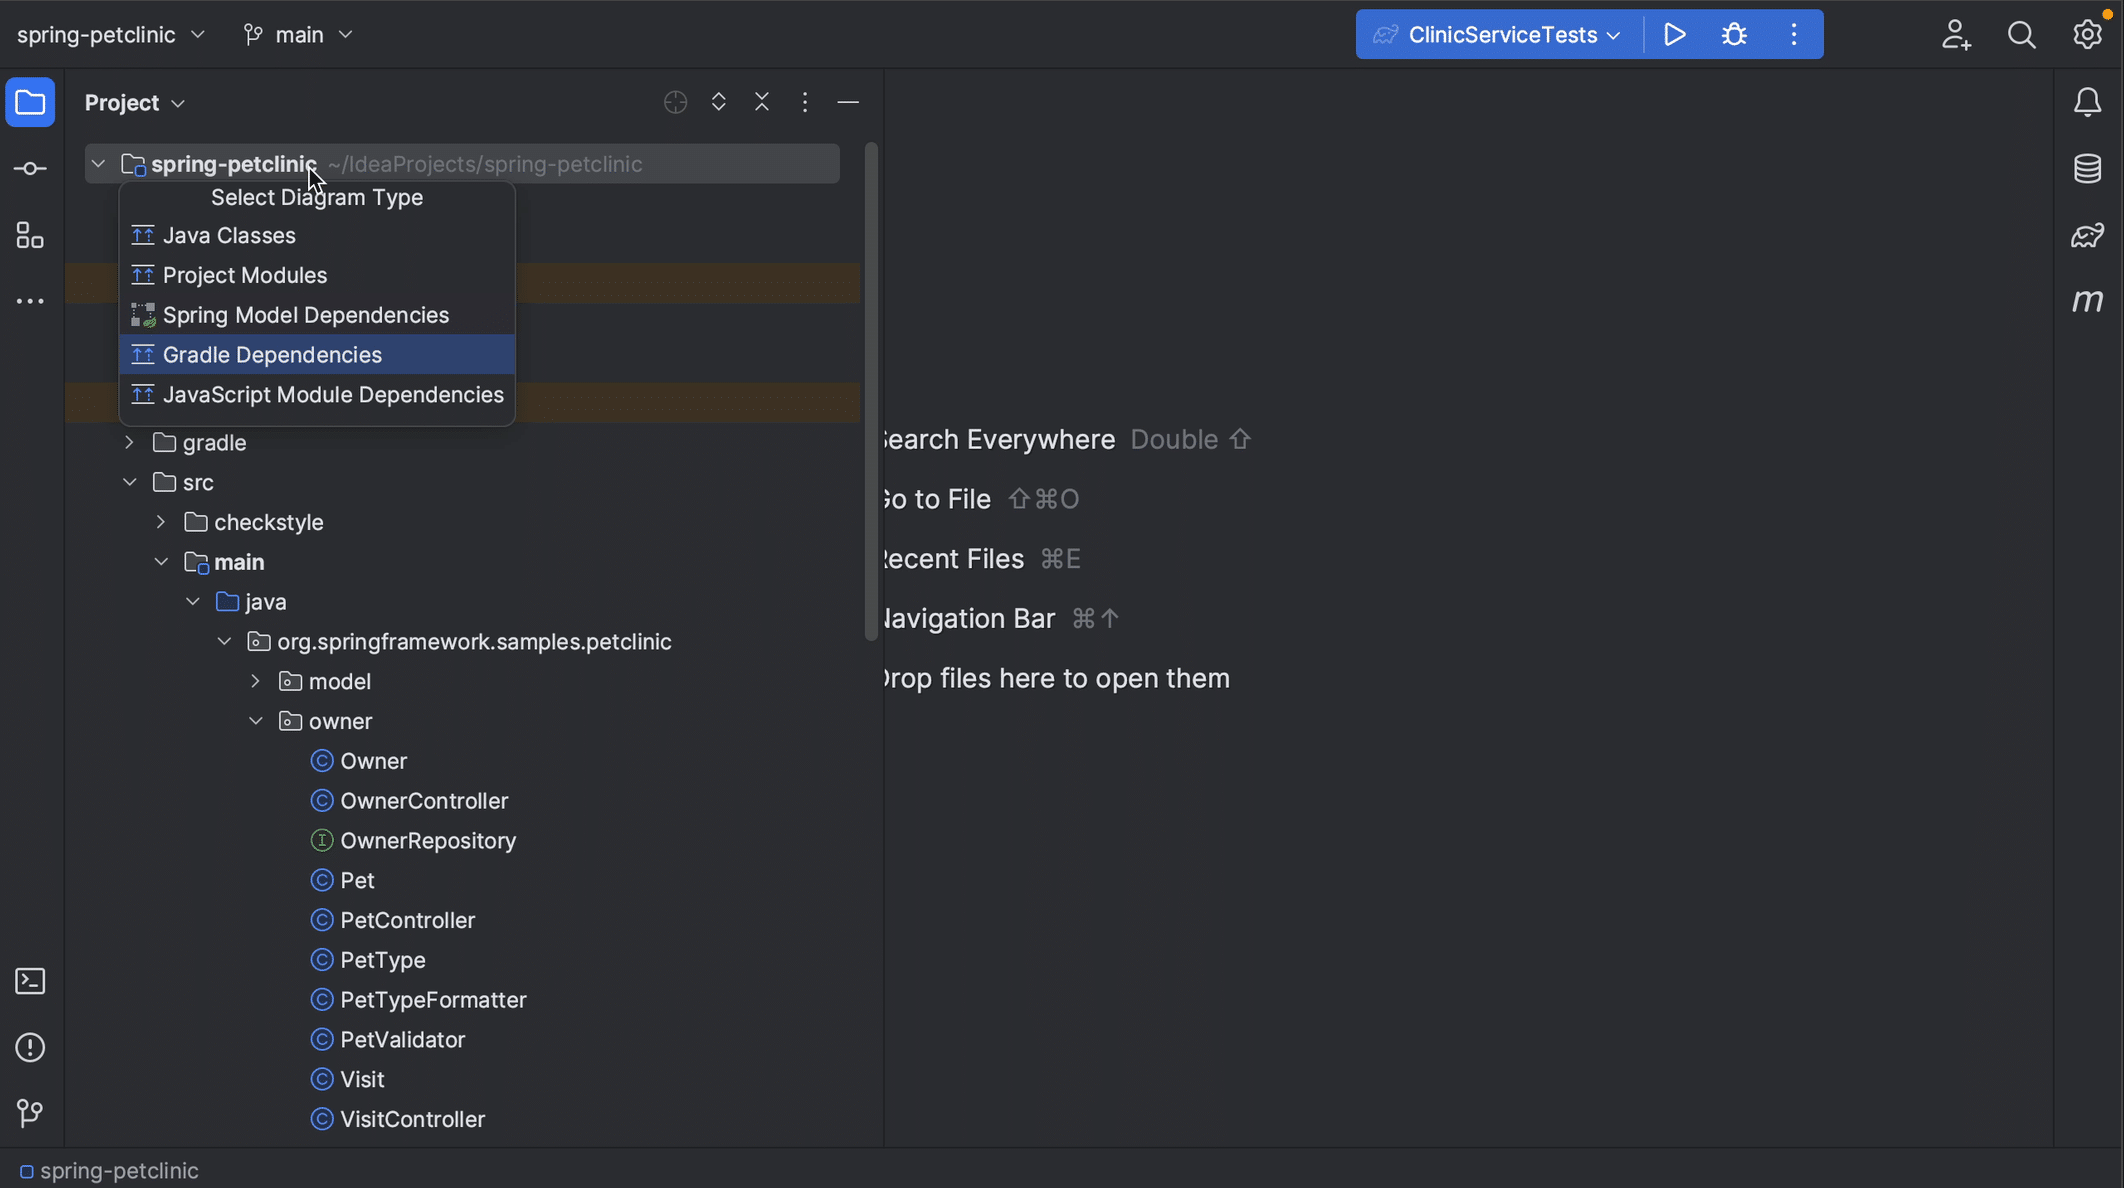
You'll notice this gives you several diagram options to choose from. In this case, we're interested in the Gradle Dependencies, so we select that one.
We can hide all tool windows (⇧⌘F12 on macOS / Control+Shift+F12 on Windows/Linux), so we can focus on the diagram.
Zoom in
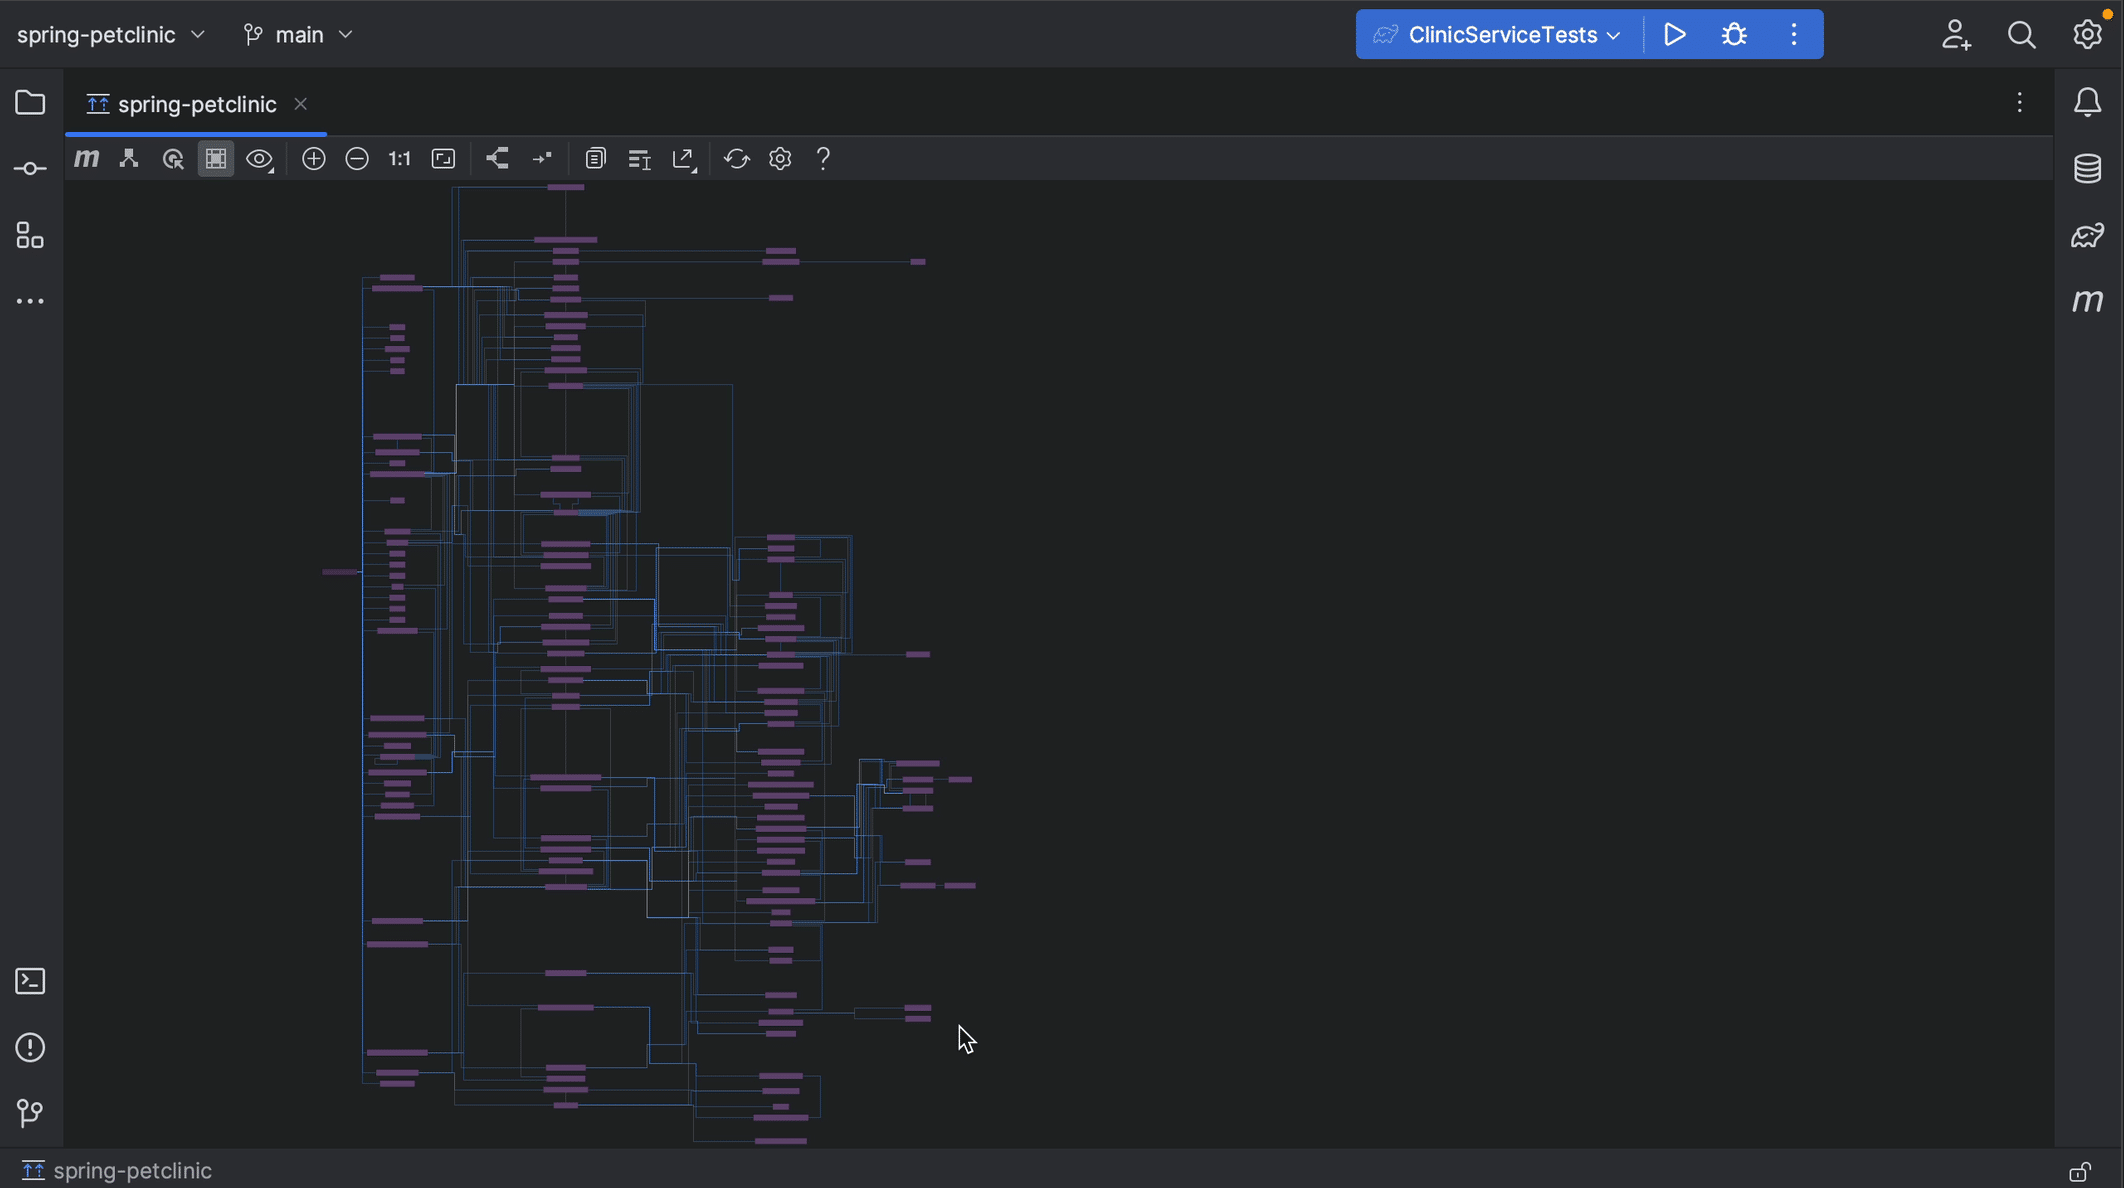
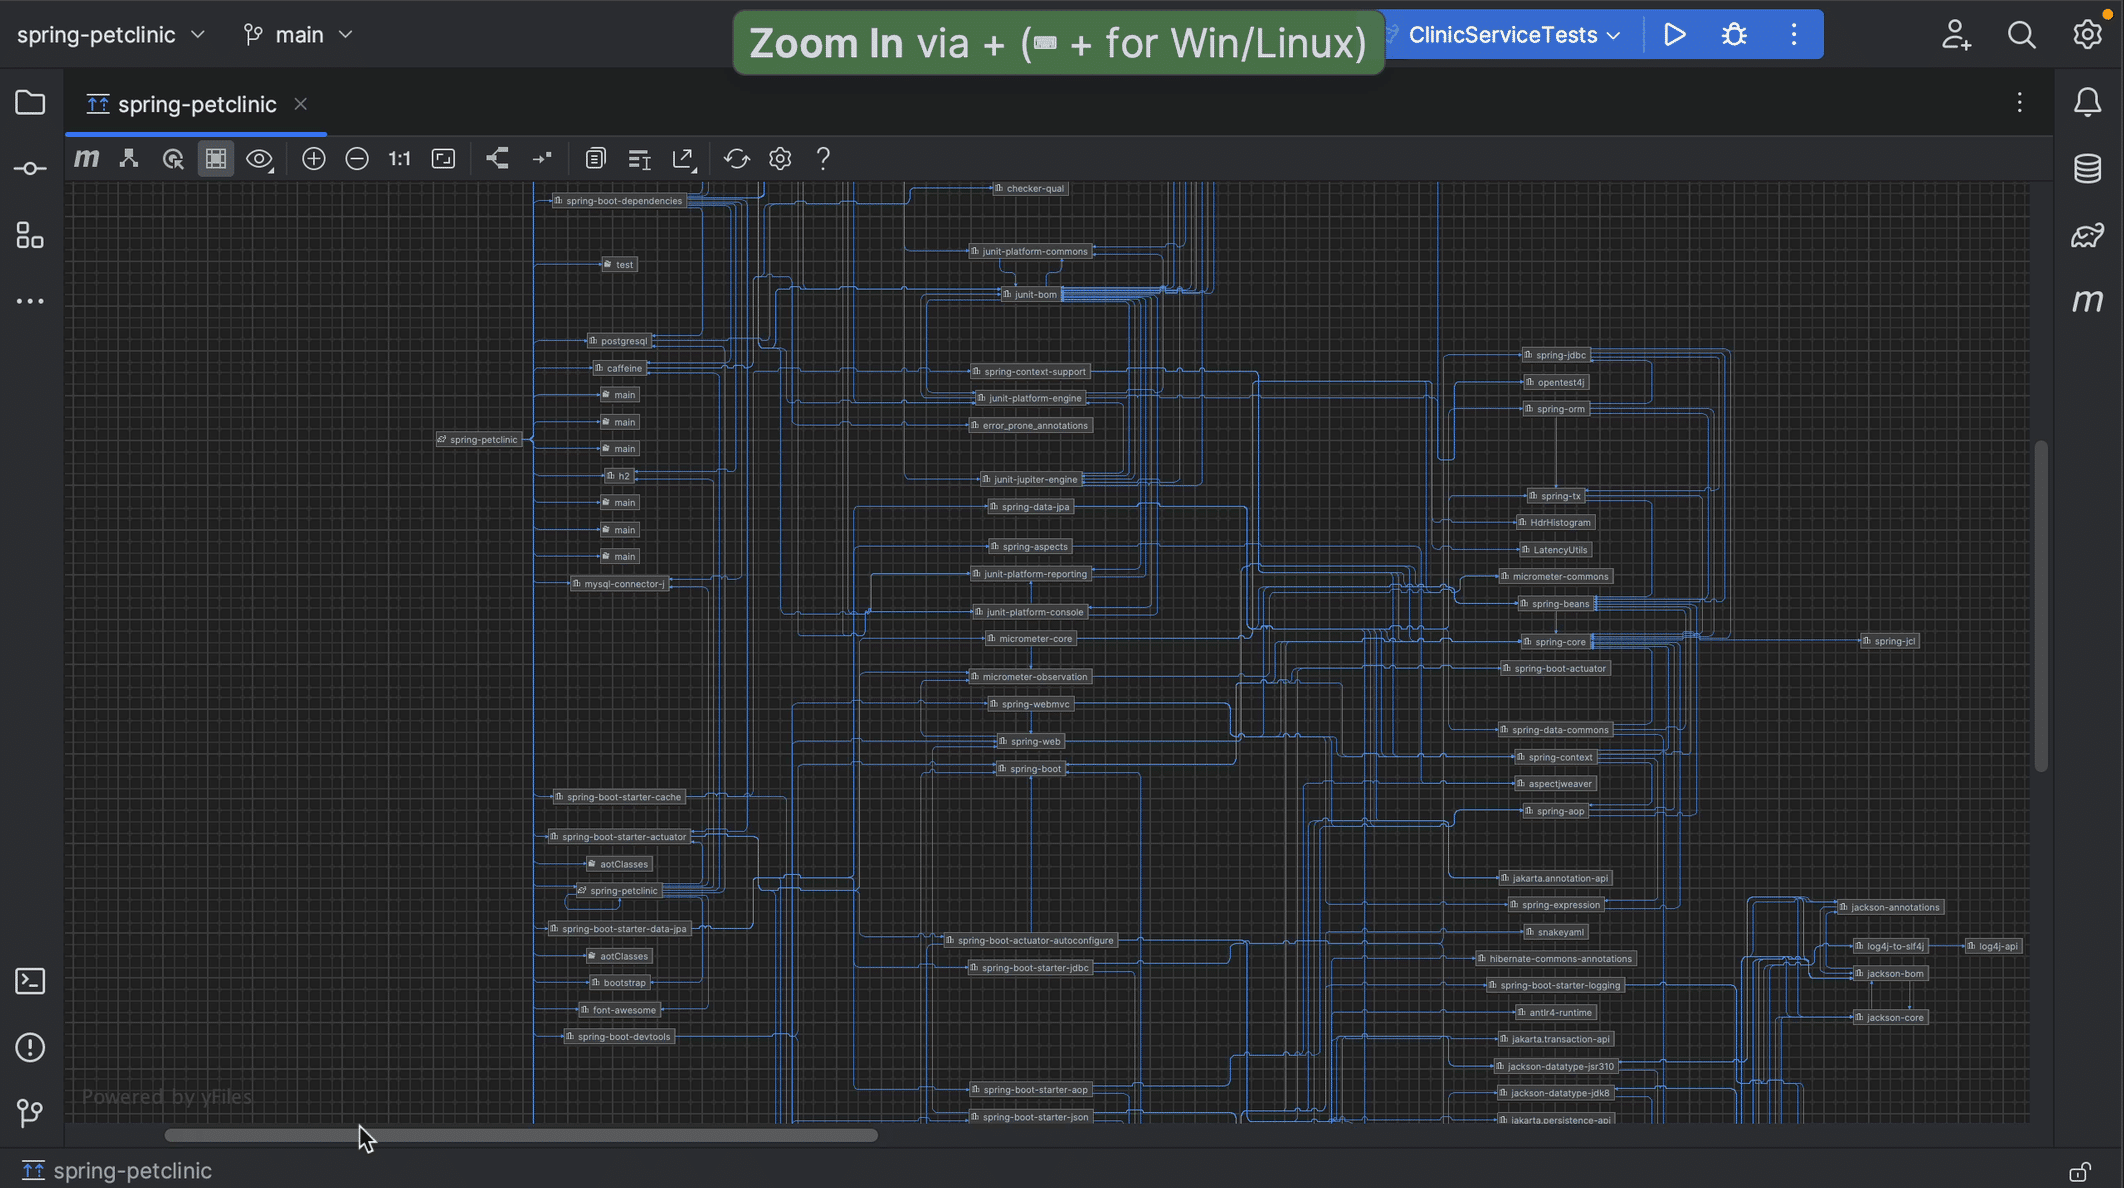
If the project we're looking at pulls in a lot of transitive dependencies, like this example, the diagram can be quite large.
We can zoom in and out using the + and - keys, or the + and - buttons in the diagram window.
Finding a specific dependency
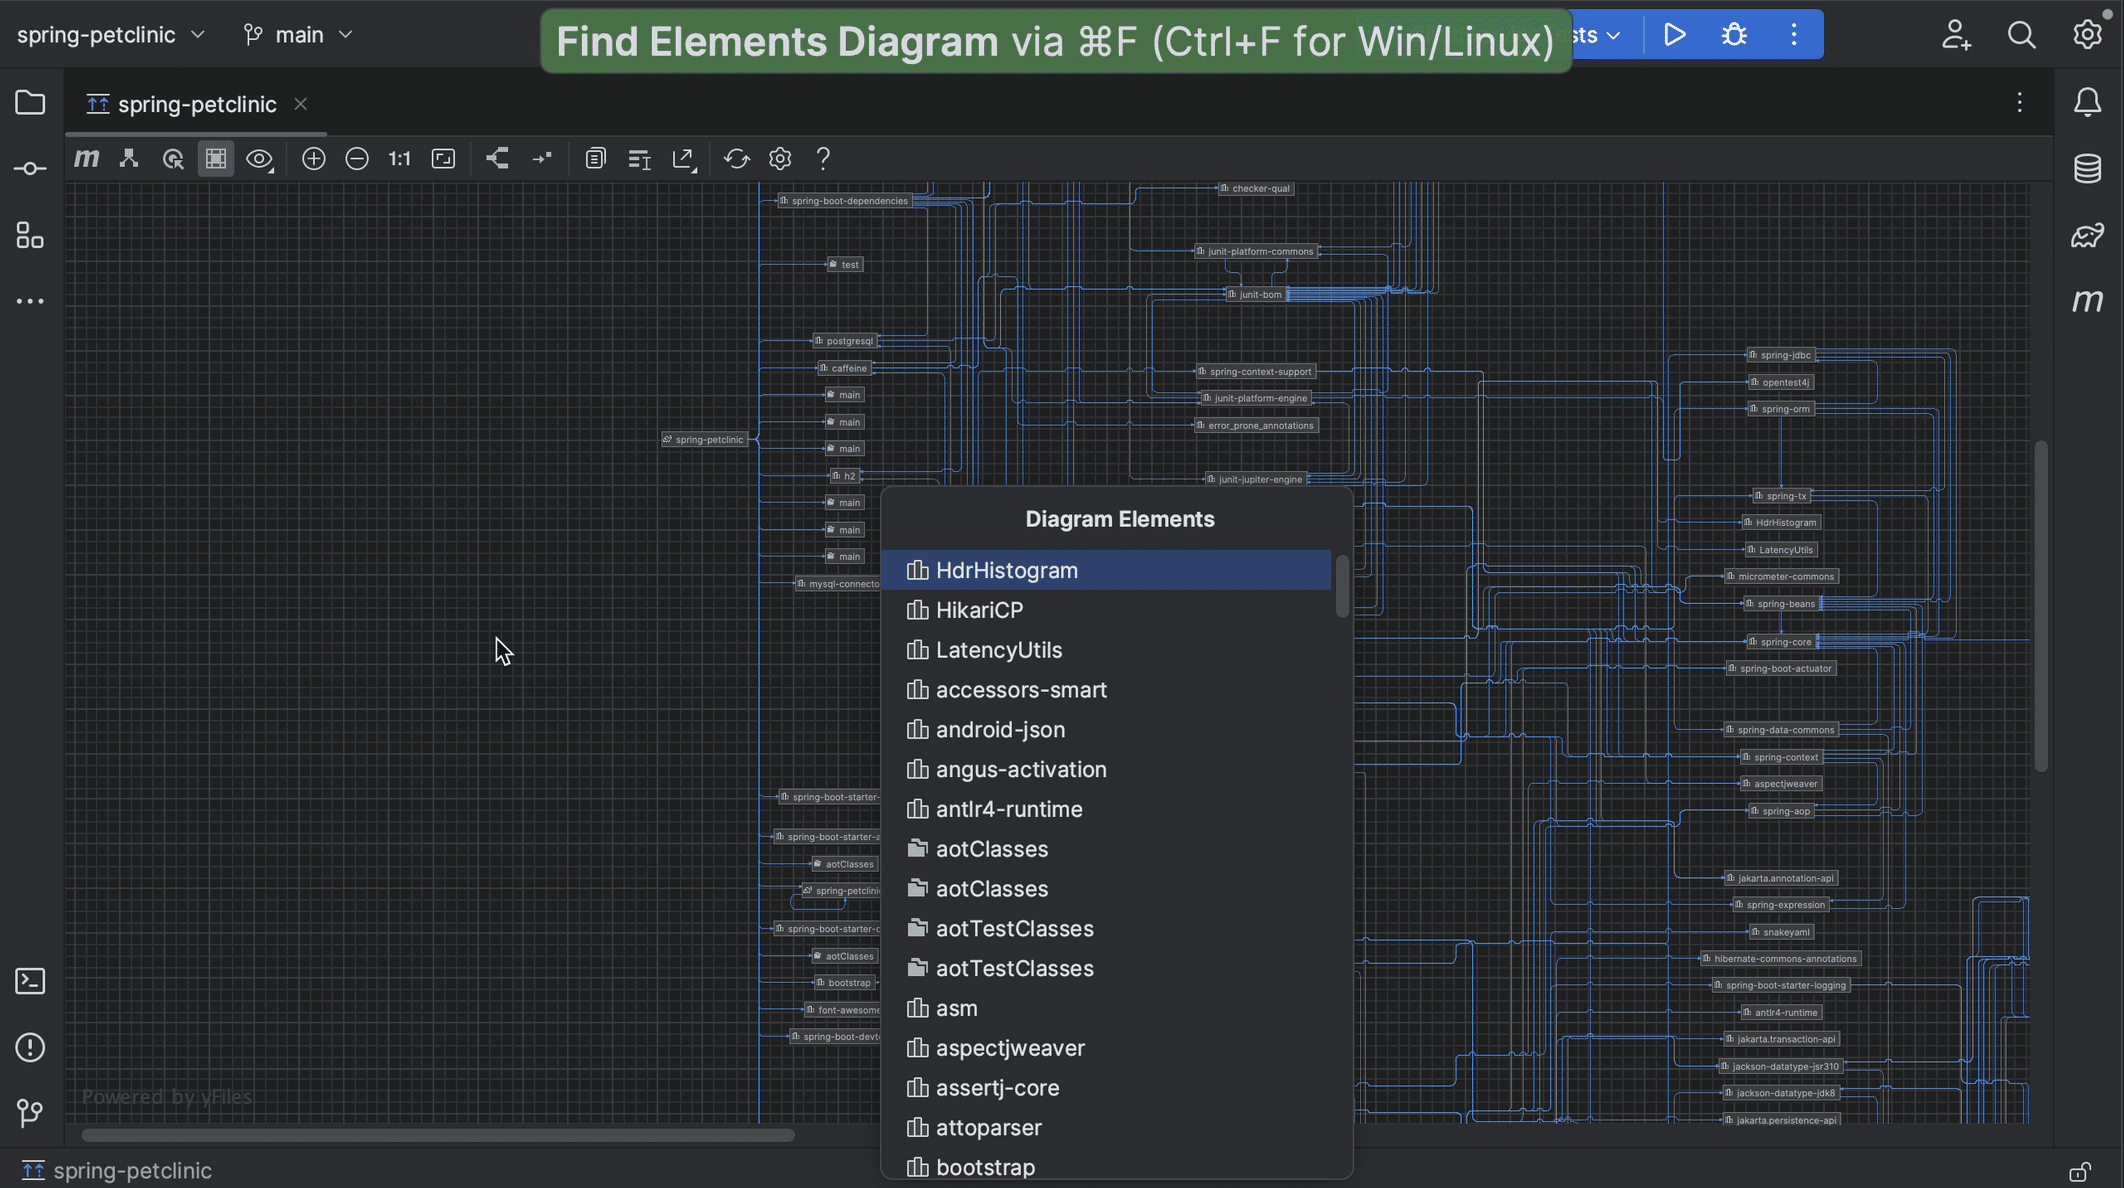
We want to look for a specific dependency and see where we get it from.
We can search for a dependency using ⌘F (on macOS) or Ctrl+F (on Windows/Linux) to find it in the diagram.
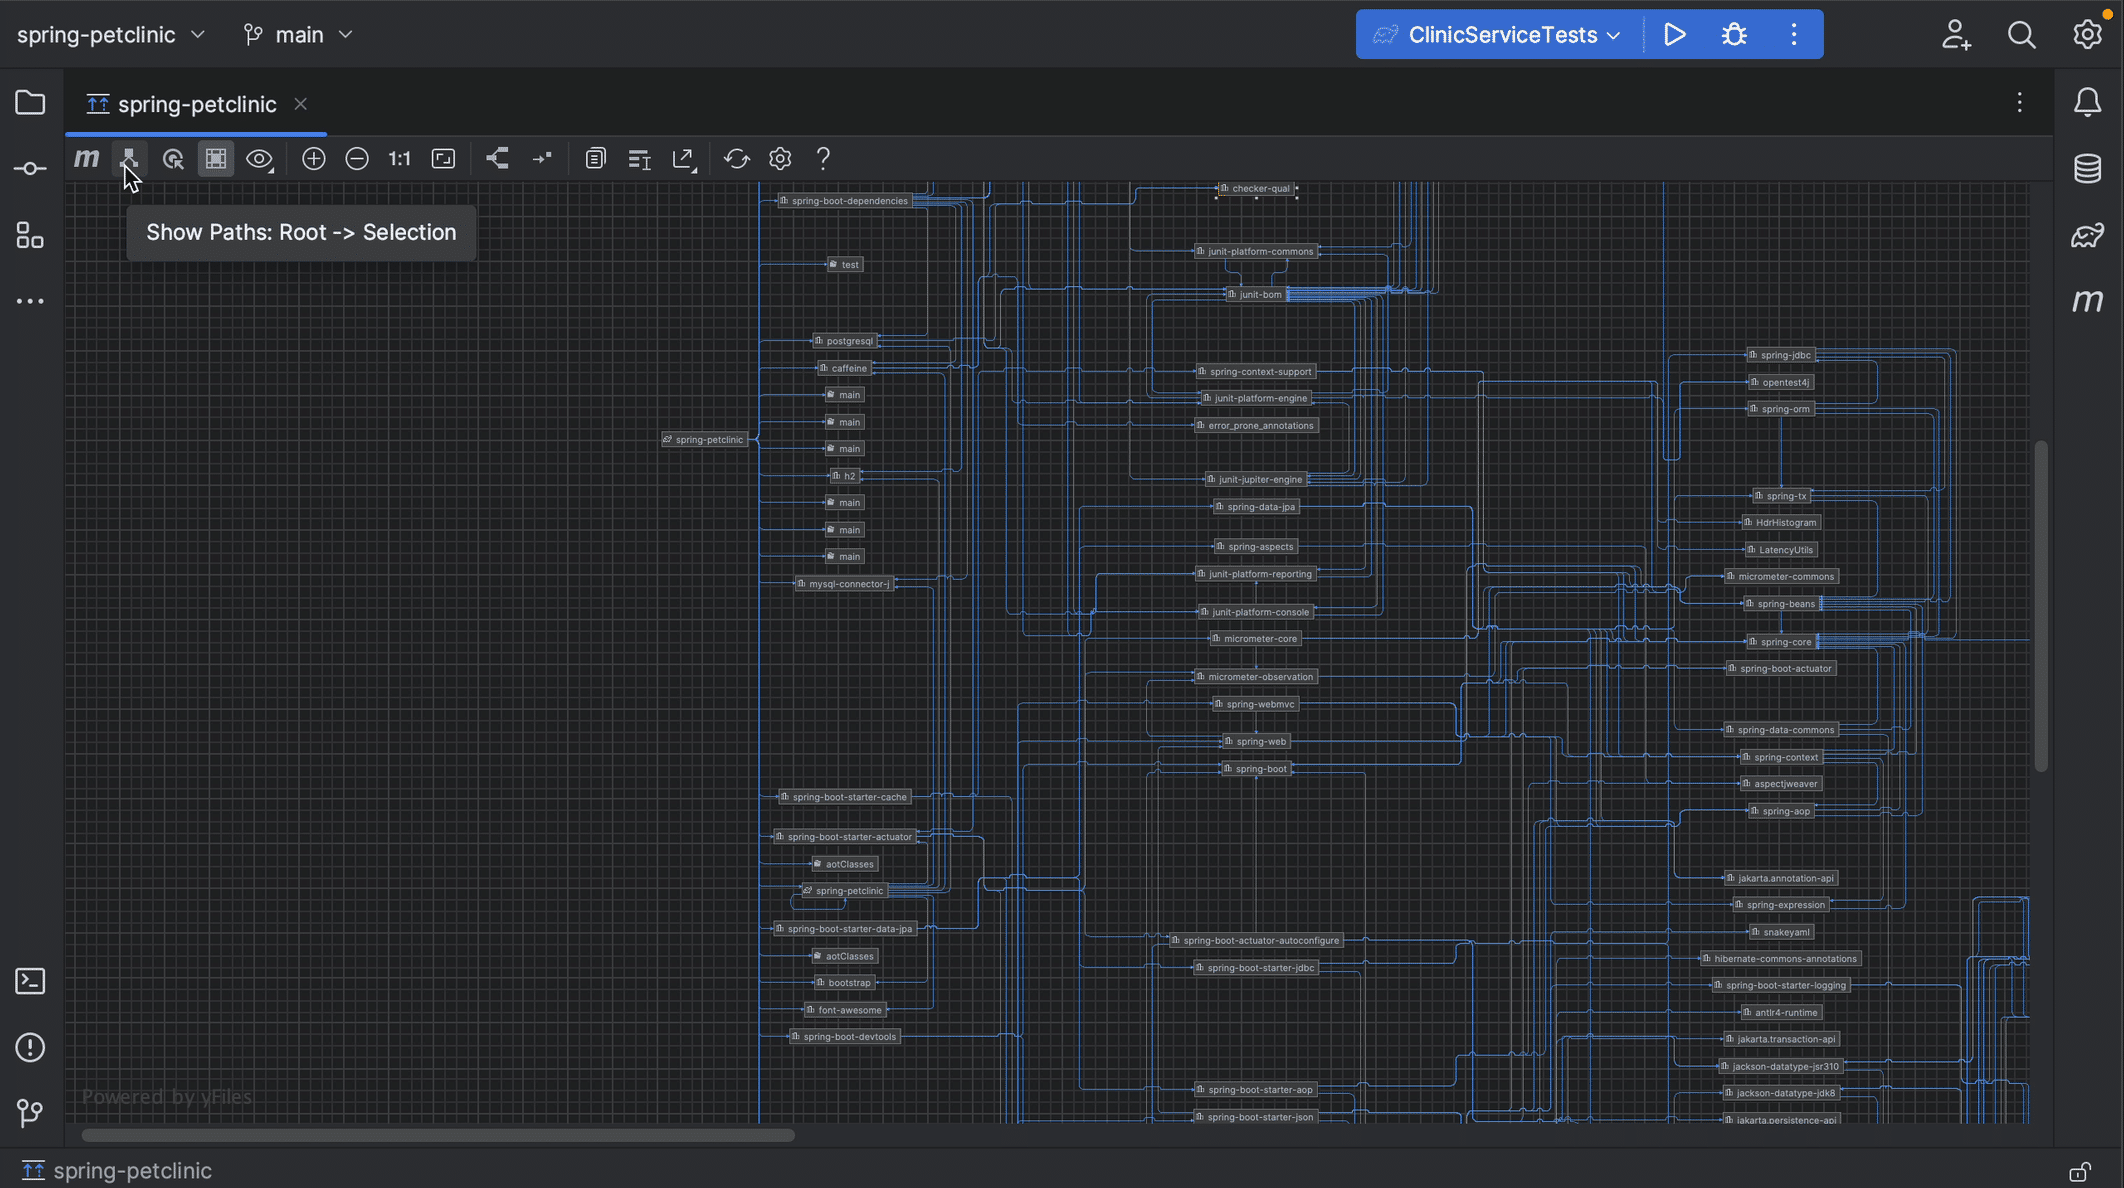
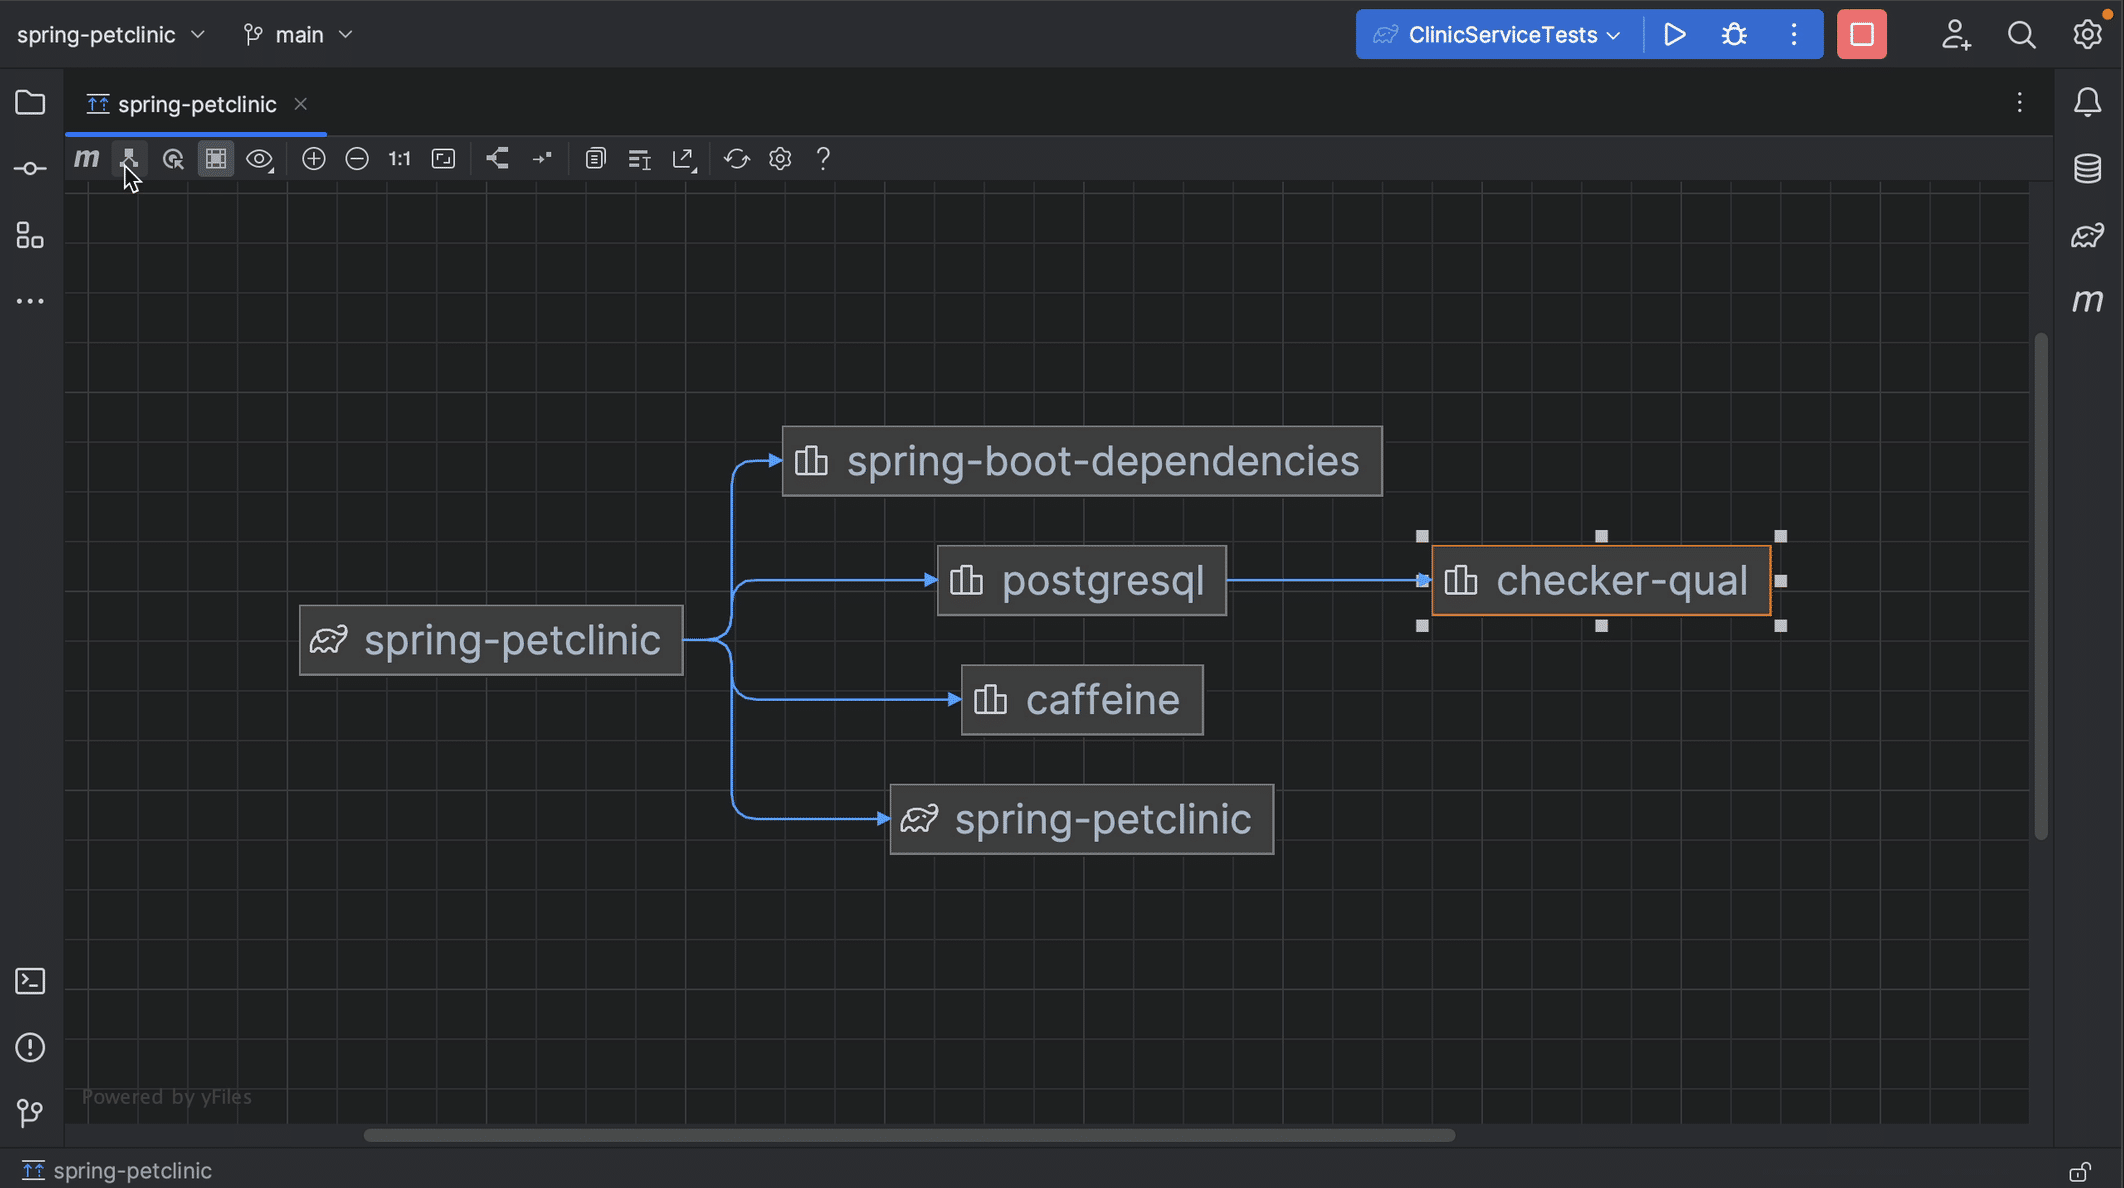
We can check the path for this dependency and click related dependencies to follow this path to the root.
Focus on related nodes
We have other options to look into specific dependencies. For example, we can zoom in on a specific dependency and the related nodes.
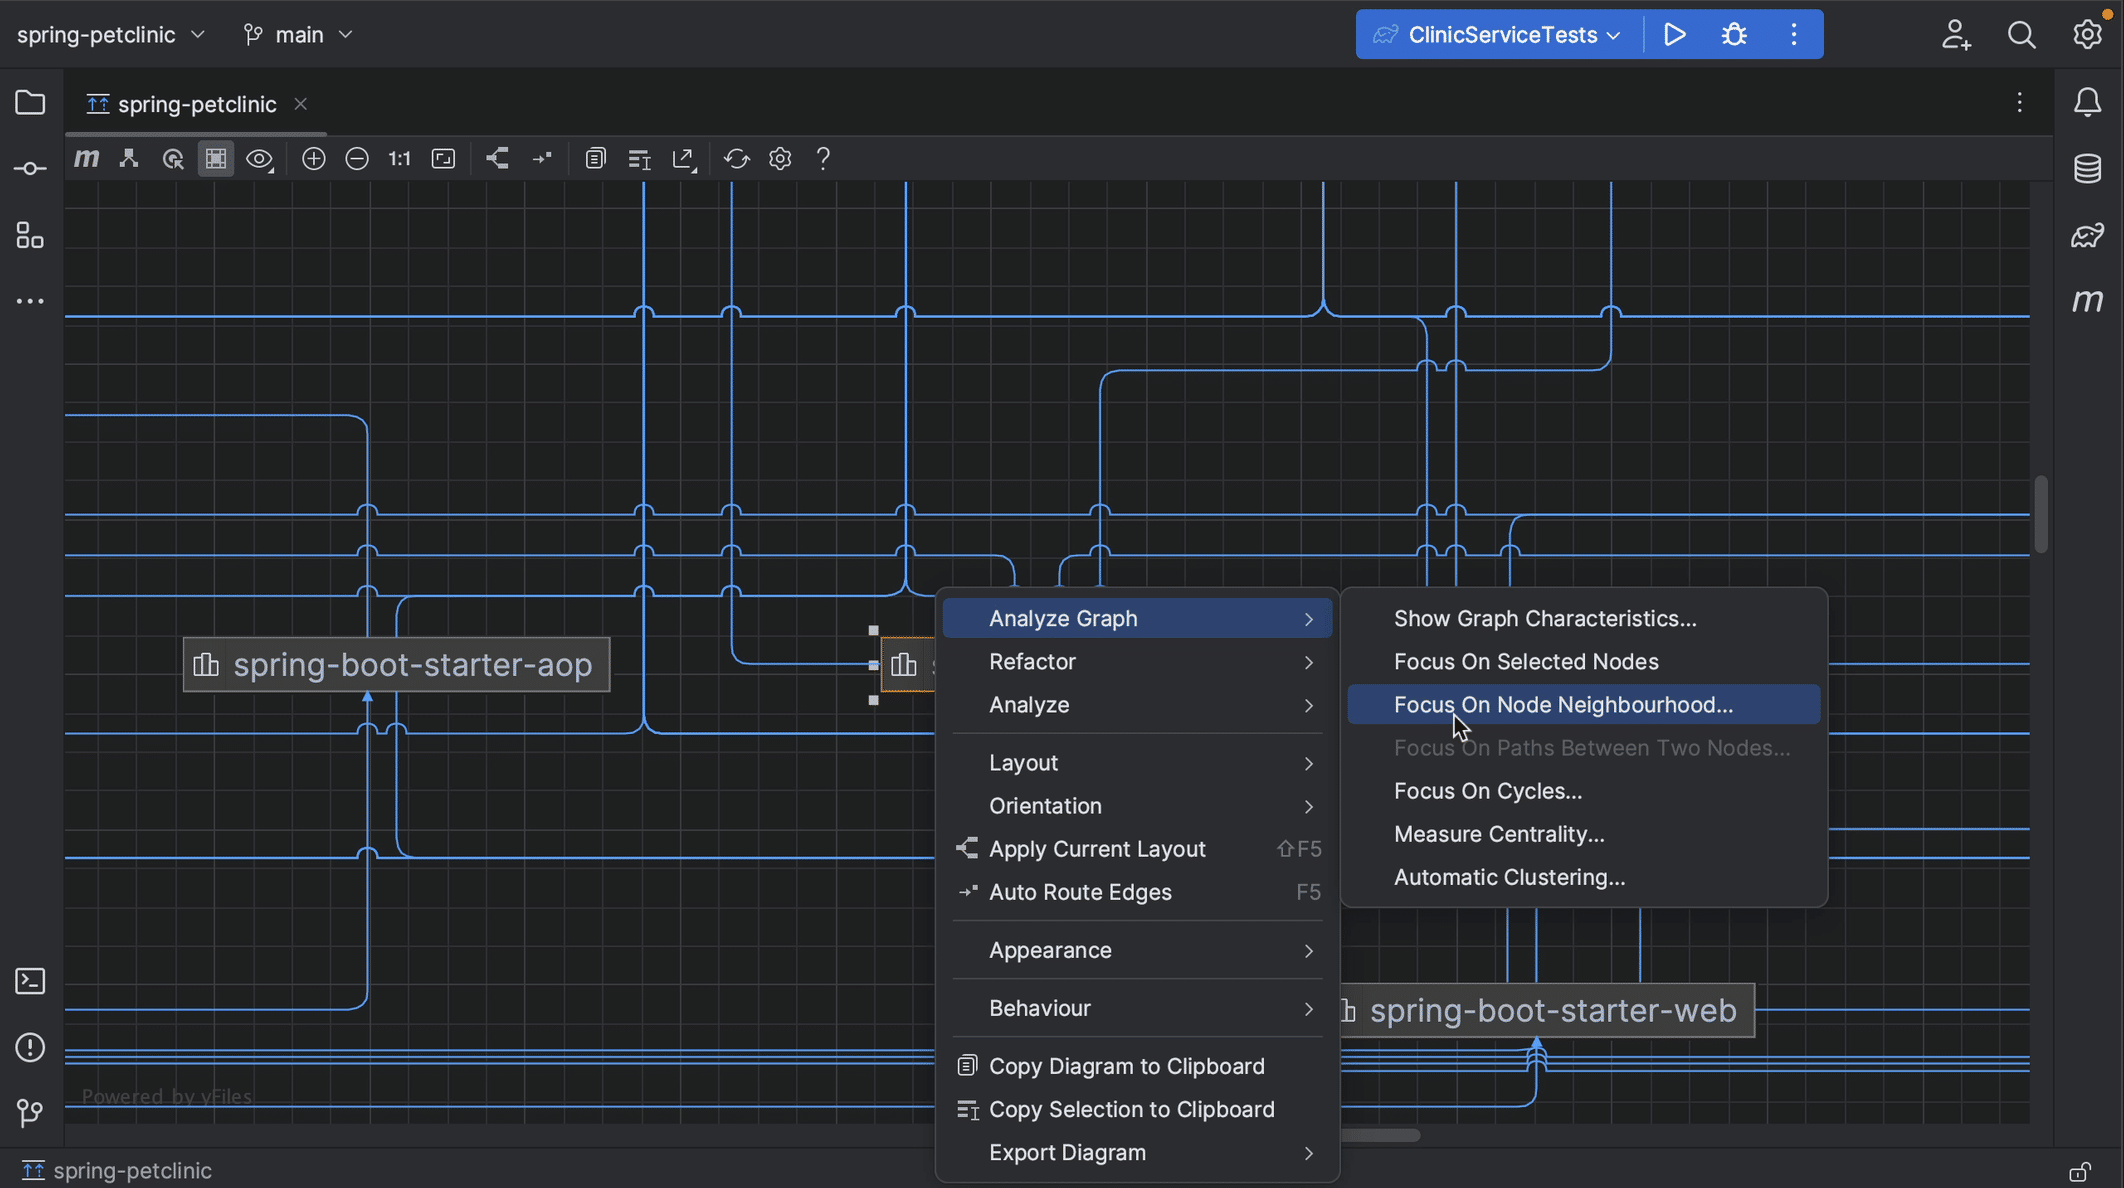
Right-click the dependency you're interested in, and from the context menu, select Analyze graph > Focus on Node Neighbourhood.
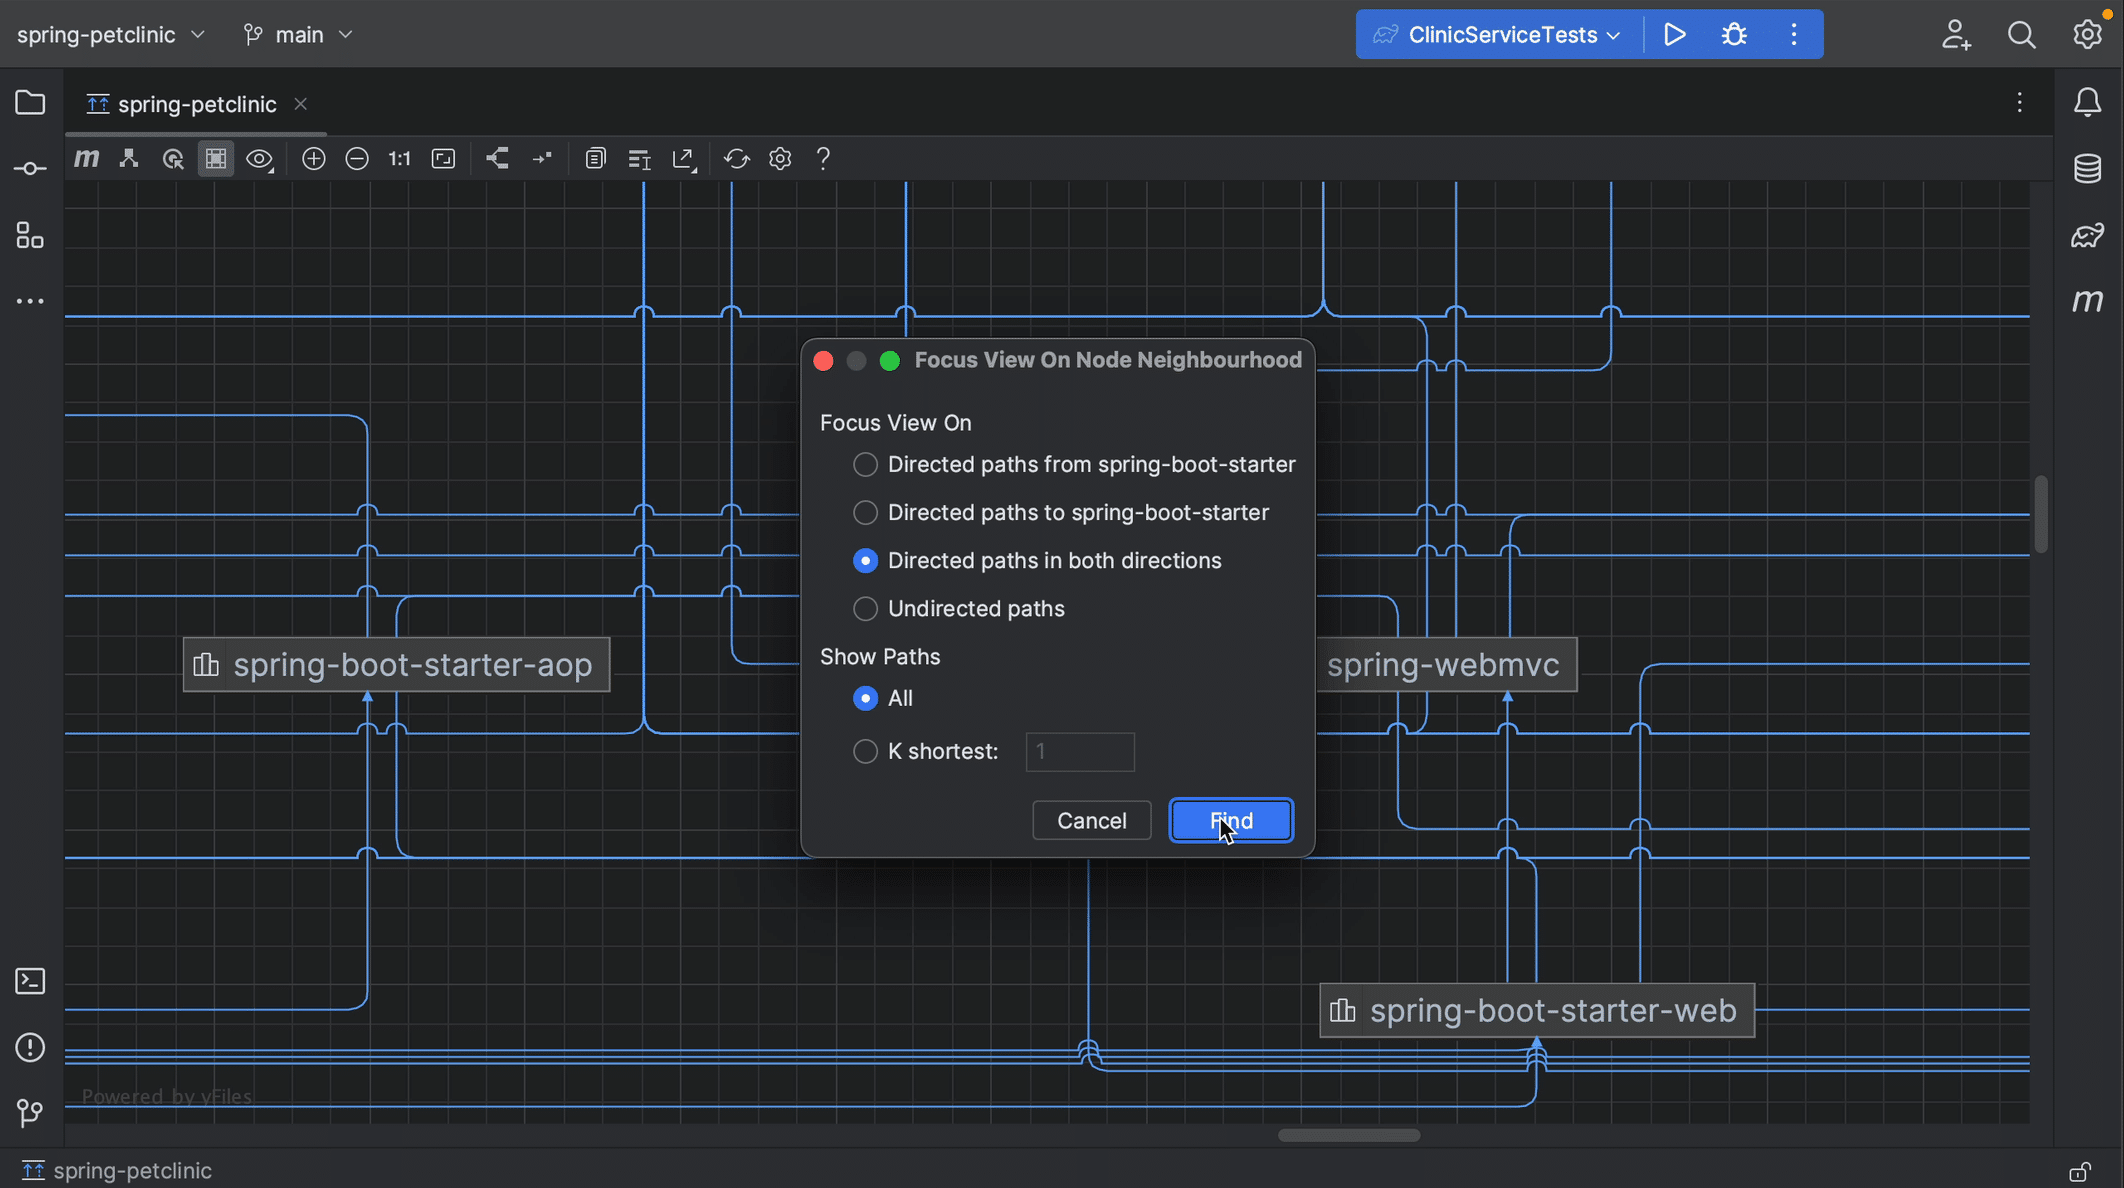
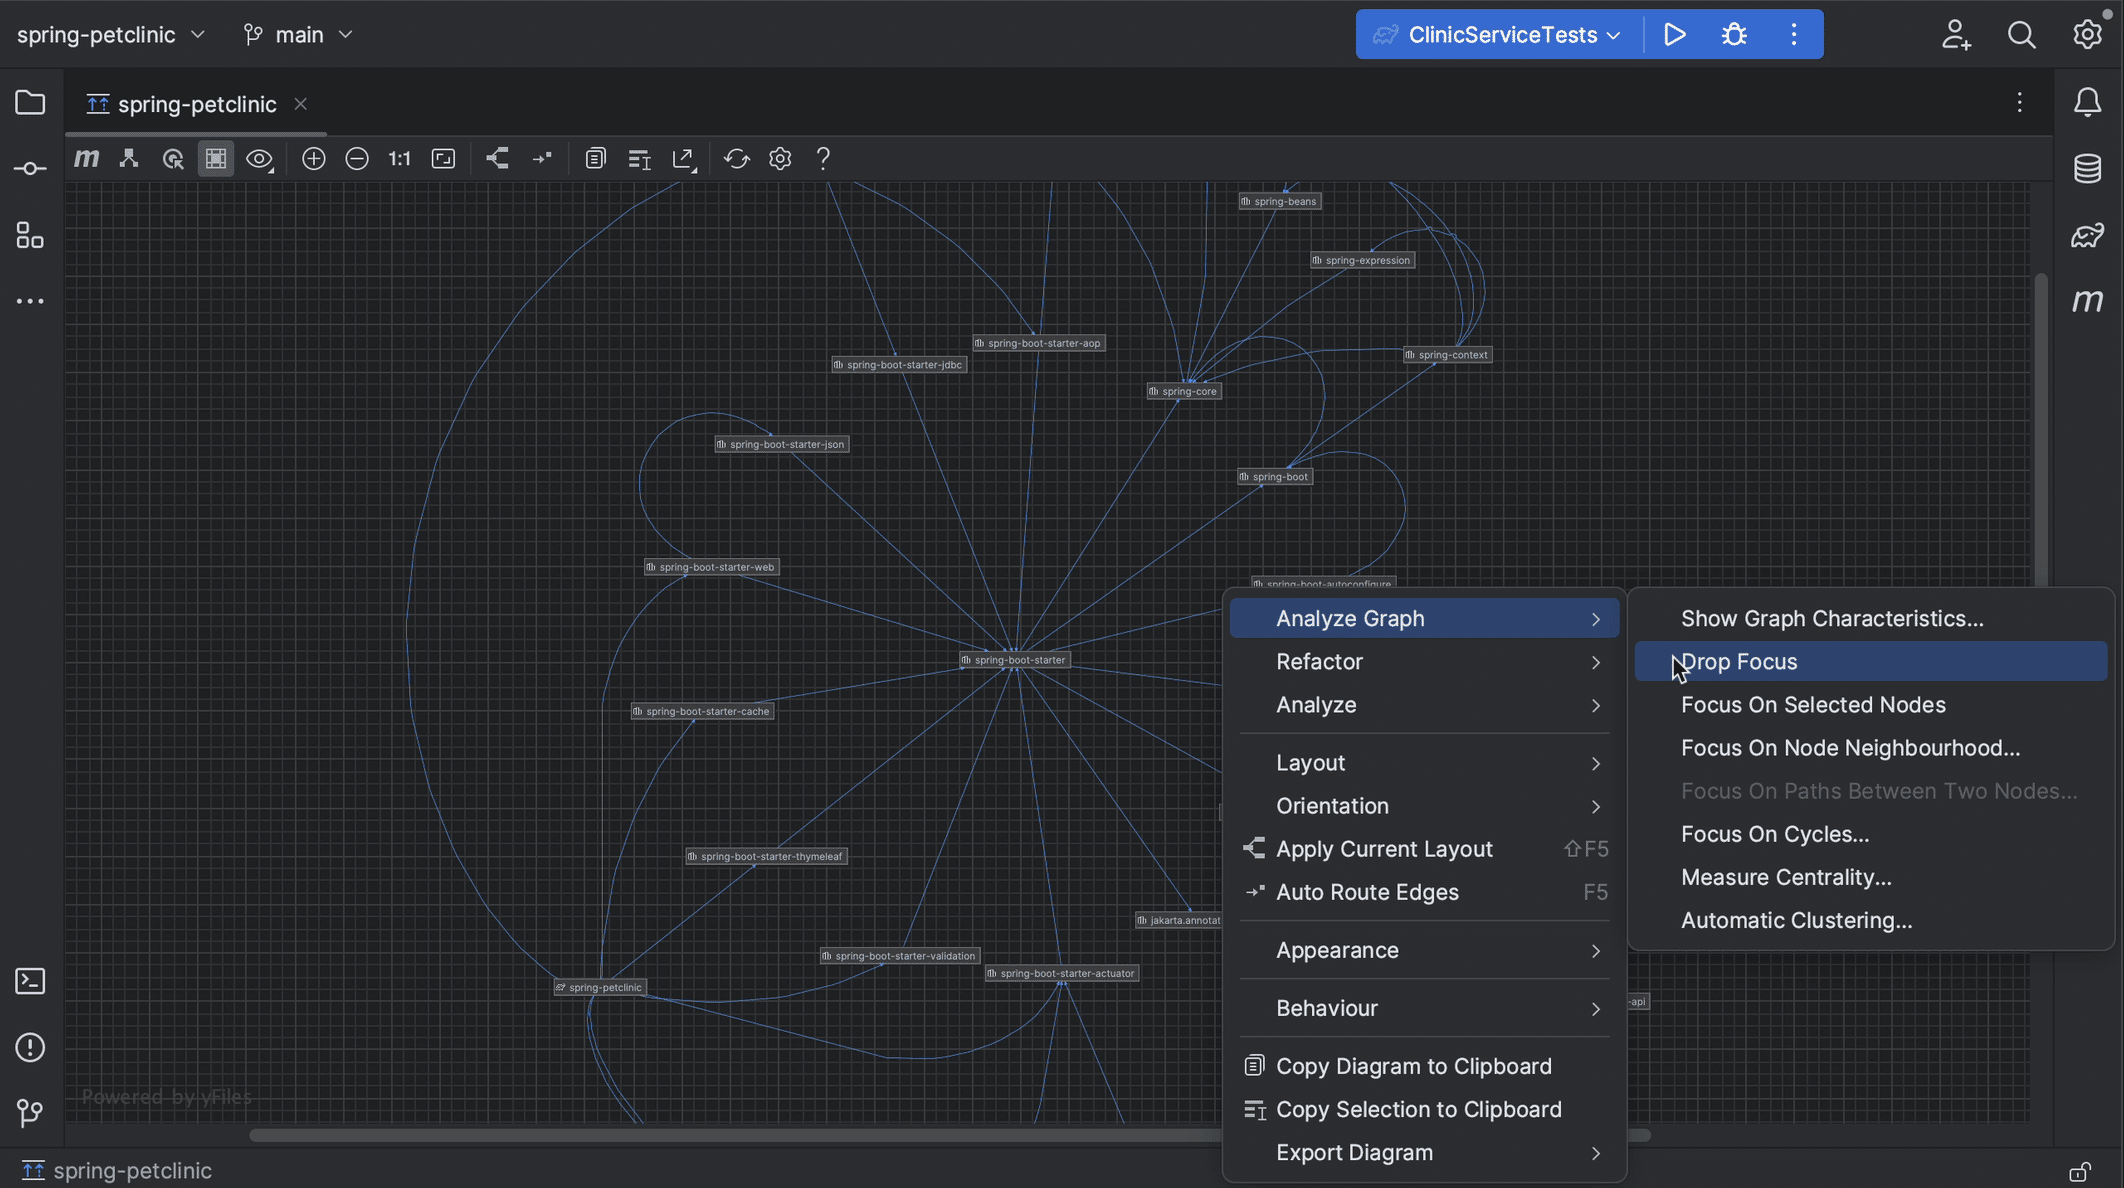
This will give you several options. In this example, we'll look at both directions. When we are done, we can reopen Analyze graph context menu and select Drop focus.
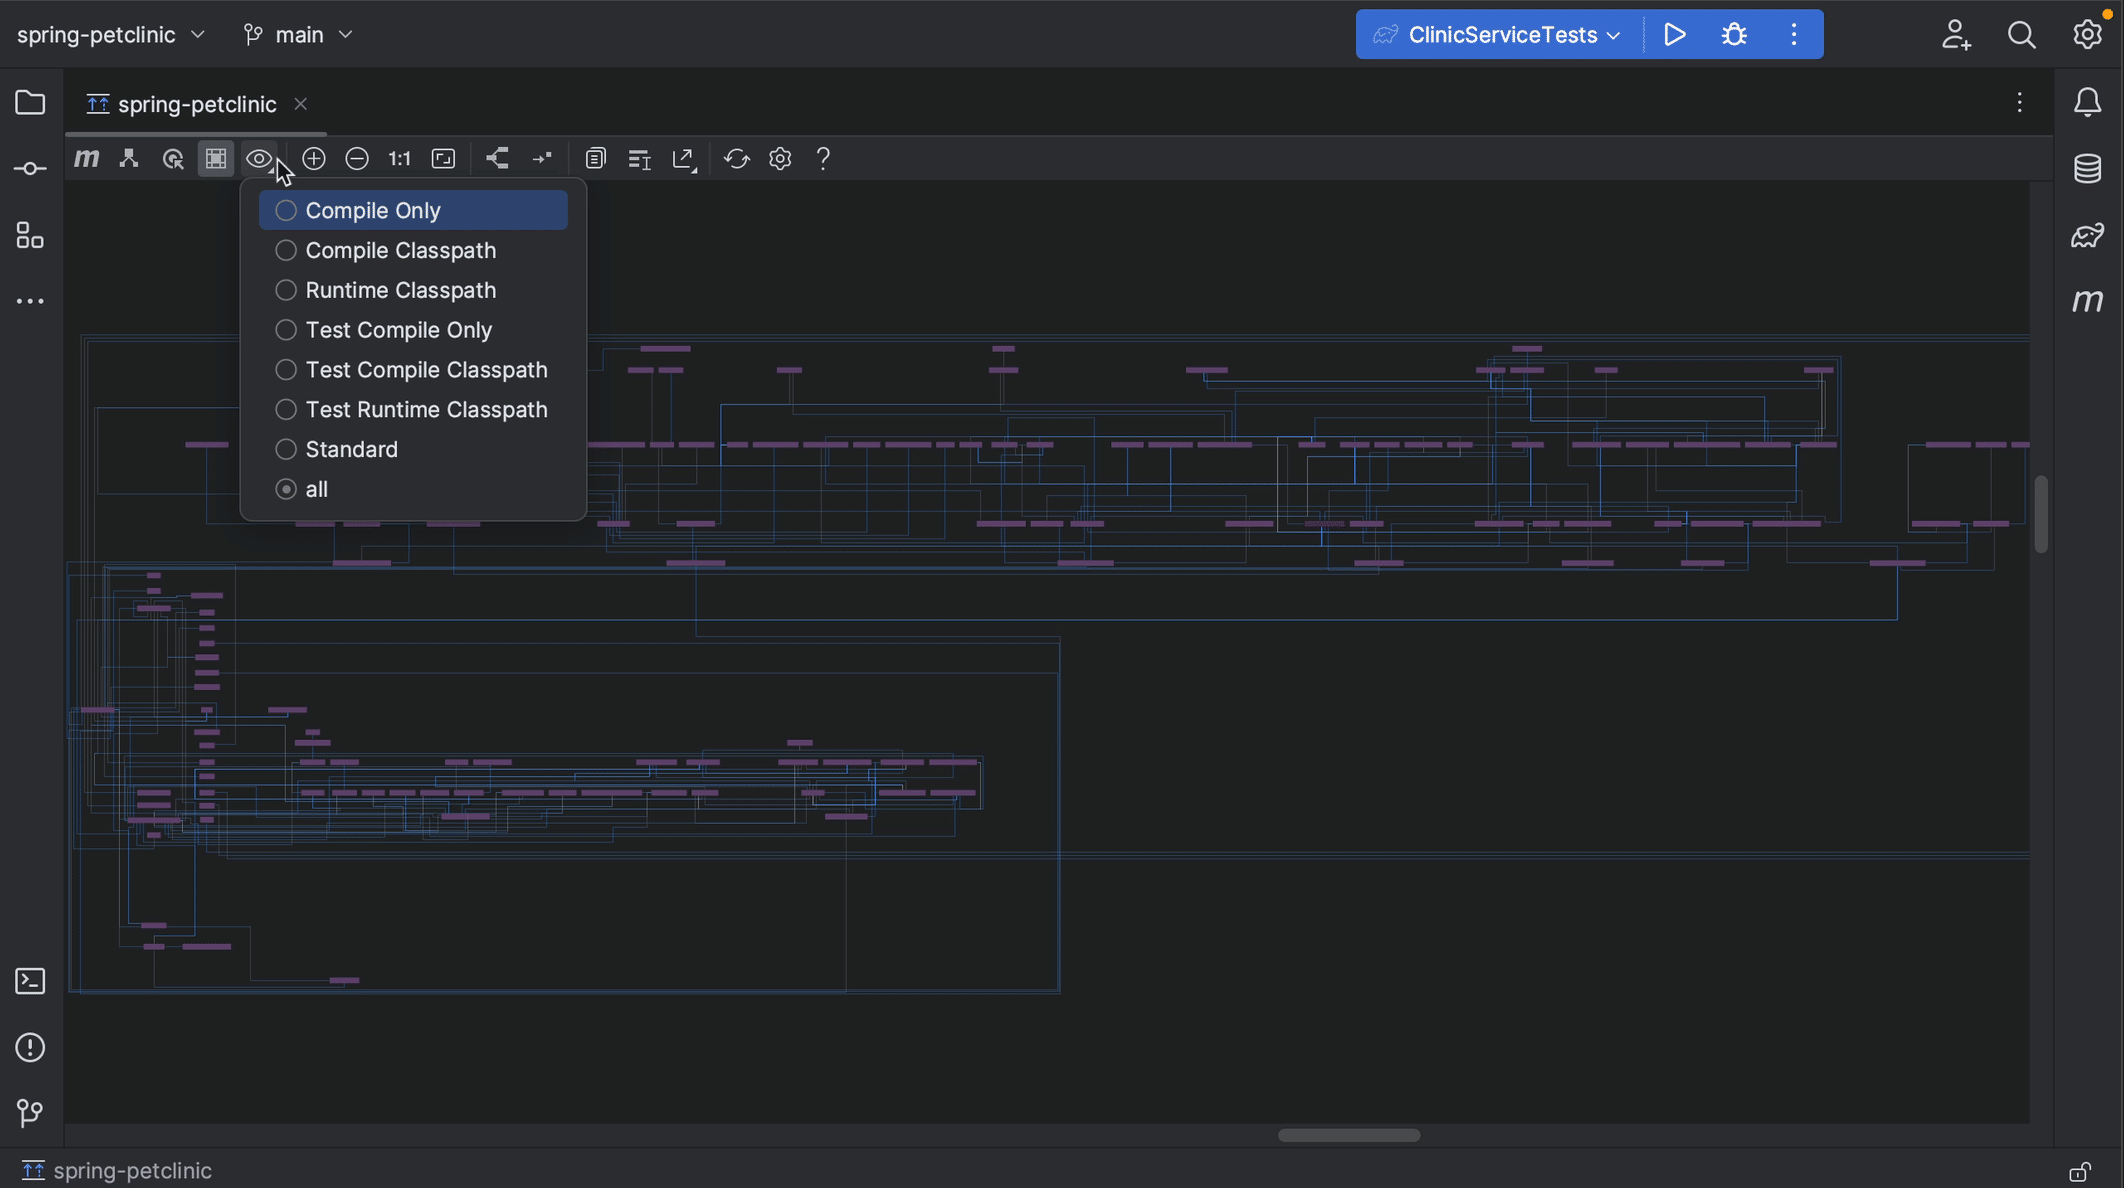
Select scopes
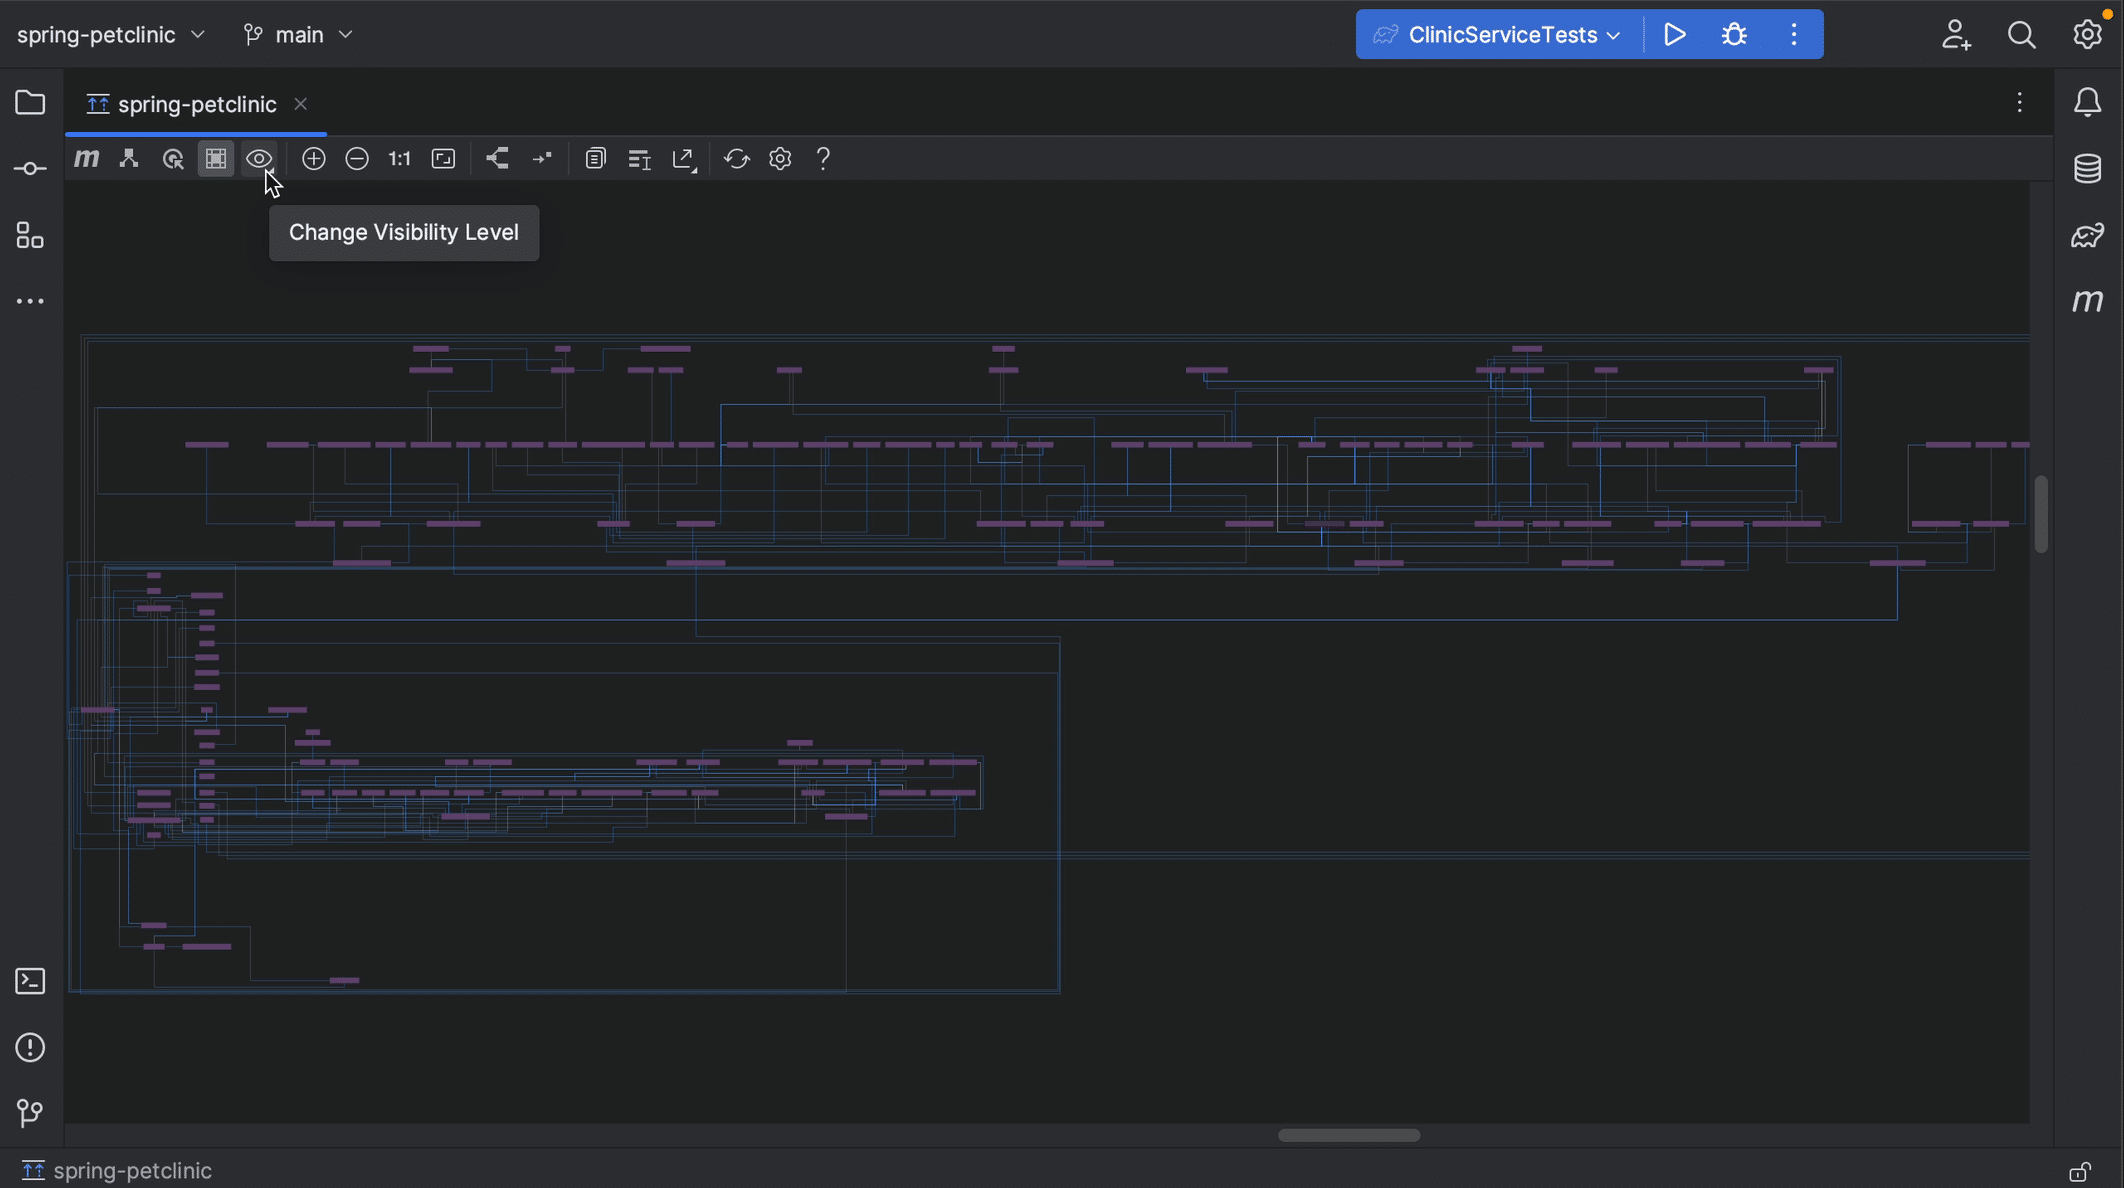
We can change the visibility level, by clicking the Change Visibility Level button for example if we want to focus on compile or runtime dependencies only.
Summary and Shortcuts
Now we know several ways to analyze our project's dependencies in IntelliJ IDEA.
IntelliJ IDEA Shortcuts Used
Here are the IntelliJ IDEA shortcuts that we used.
| Name | macOS Shortcut | Windows / Linux Shortcut |
|---|---|---|
| Recent Files | ⌘E | Ctrl+E |
| Hide all windows / Restore windows | ⇧⌘F12 | Ctrl+Shift+F12 |
| Open / Close Project Tool Window | ⌘1 | Alt+1 |
| Show Diagram | ⌥⇧⌘U | Ctrl+Alt+Shift+U |
| Zoom in (in the diagram) | + | + |
| Zoom out (in the diagram) | - | - |
| Find Elements in Diagram | ⌘F | Ctrl+F |
| Context Actions | ⌥⏎ | Alt+Enter |
Related Links
- (video) JetBrains - IntelliJ IDEA: Viewing Dependencies
- (video) JetBrains - IntelliJ IDEA: Managing Dependencies
- (video) JetBrains – IntelliJ IDEA Ultimate: Package Checker
- (docs) JetBrains - Maven Dependency Analyzer
- (docs) JetBrains - Gradle Dependency Analyzer
- (docs) JetBrains - View Maven dependencies as a diagram
- (docs) JetBrains - View dependencies as a diagram
- (code) JetBrains - intellij-samples
- (code) Spring PetClinic
- (book) Getting to Know IntelliJ IDEA - Trisha Gee & Helen Scott
- May 11, 2023
- 6 min read






Comments (1)
Payara Monthly Catch: May 2023
12 months ago[…] Analyzing dependencies in Intellij IDEA– If you’re working on a real world project, you’re probably using external dependencies. You might need to analyze which dependencies your application uses.Marit van Dijk shows you IntelliJ IDEA can help. […]