JDWP, onthrow and a mysterious error
- October 26, 2023
- 5 min read
In my previous Java-related blog post called Level-up your Java Debugging Skills with on-demand Debugging, I showed you how to use the onthrow option of the JDWP agent to start the debugging session on the first throw of a specific exception.
This gave us a mysterious error in JDB:

And I asked if somebody had any ideas. No one had, but I was at Devoxx Belgium and happened to talk with Aleksey Shipilev about it at the Corretto booth:
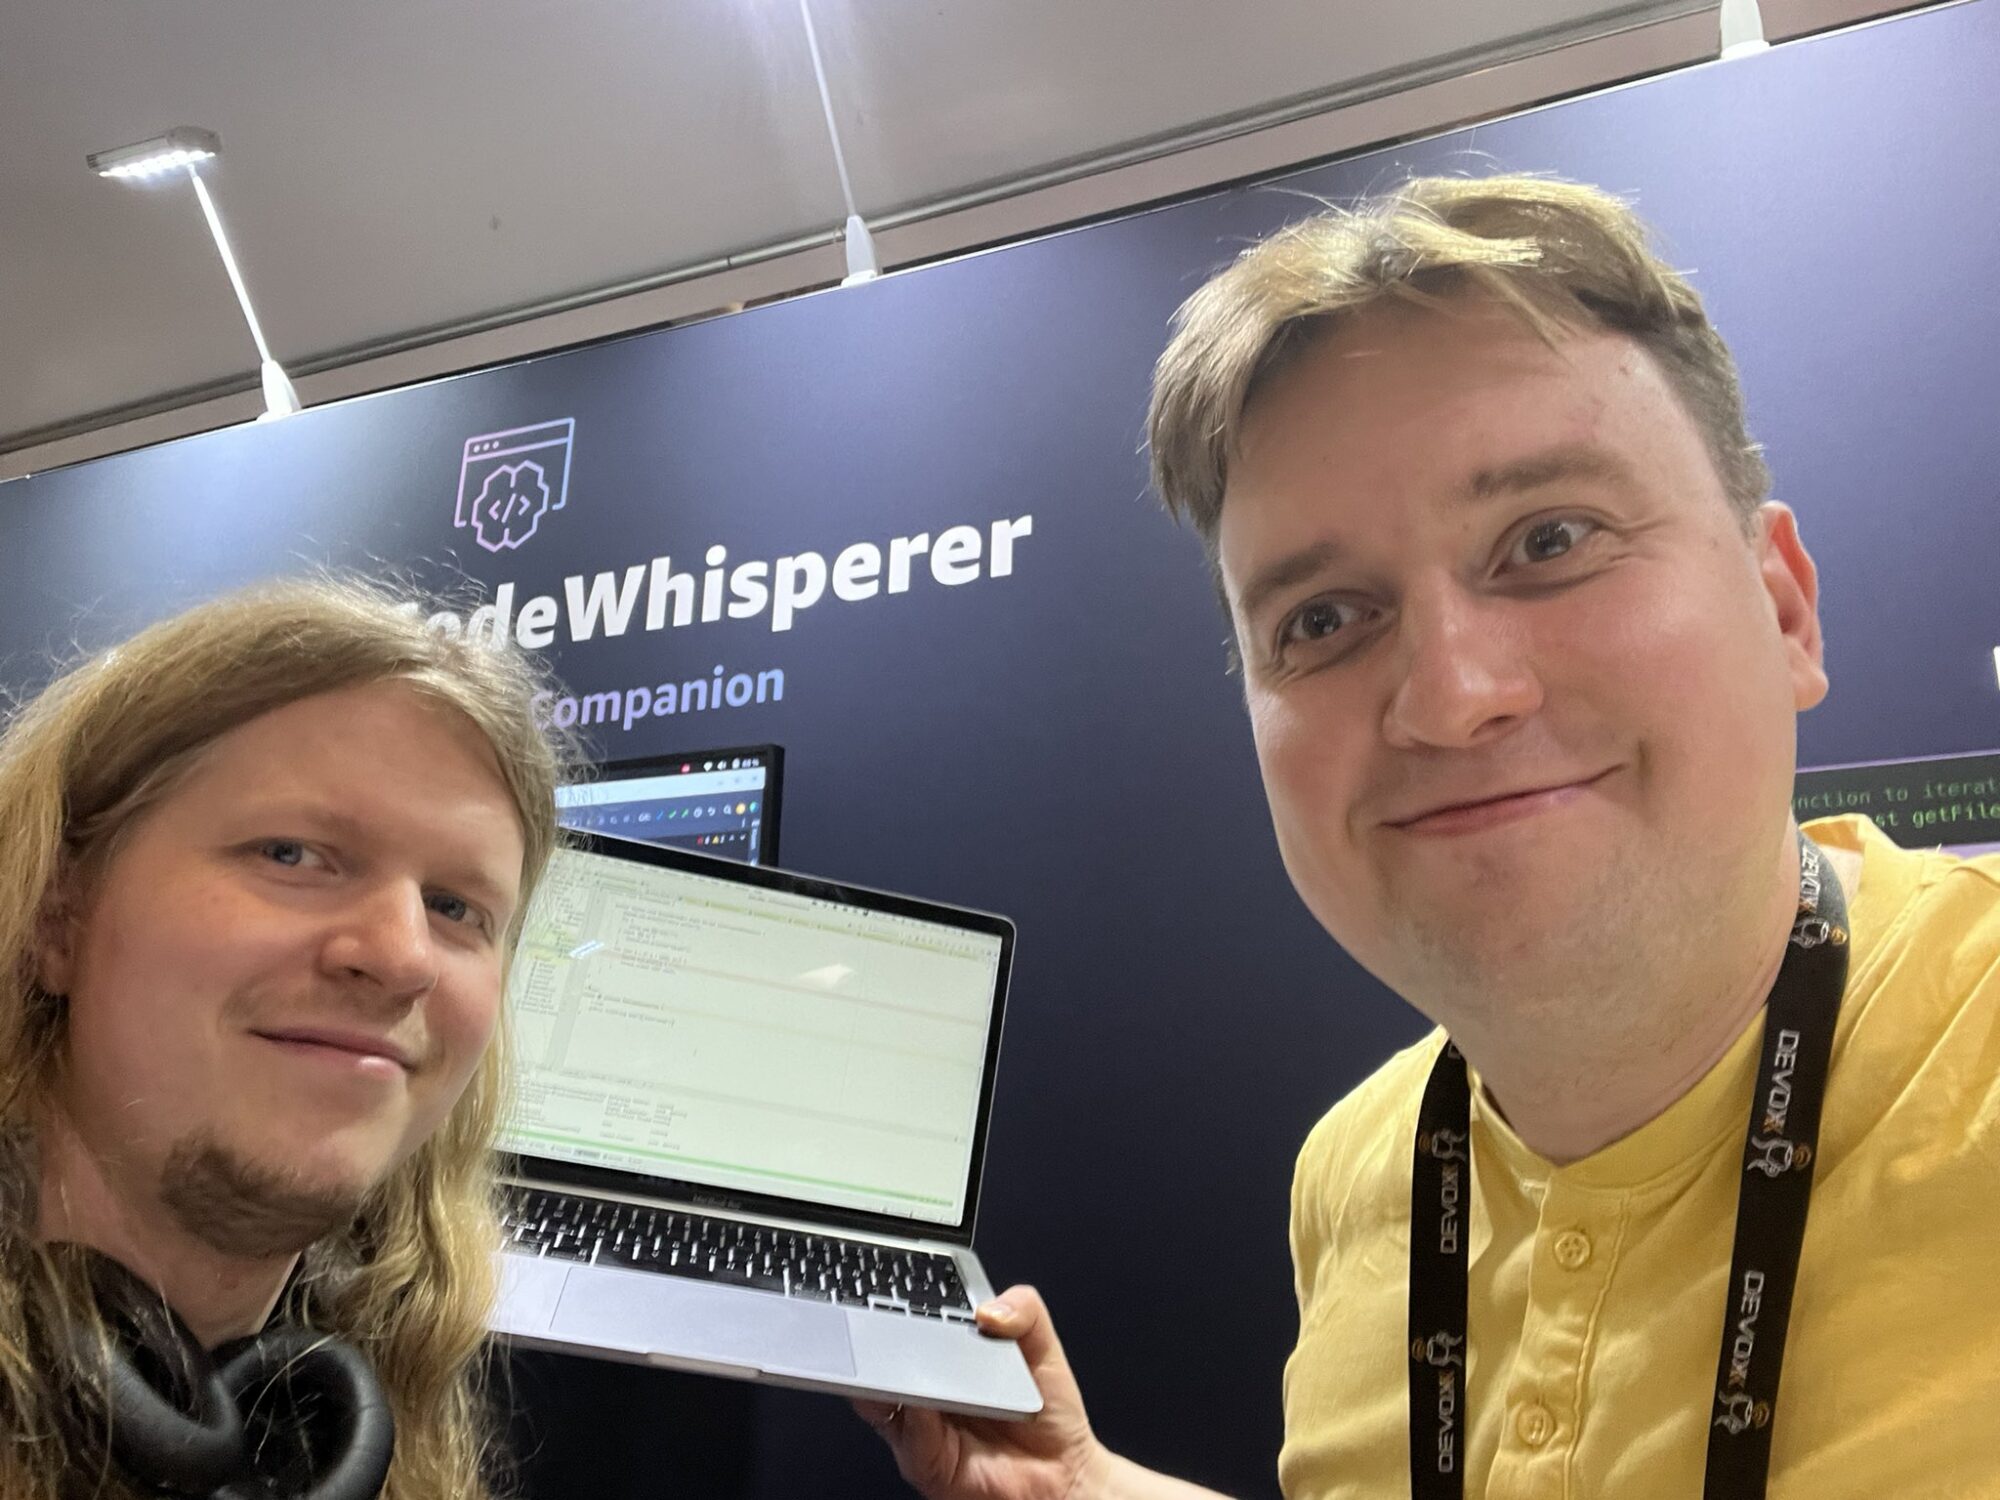
in the Coretto booth (Tweet)
We got a rough idea of what was happening, and now that I'm back from Devoxx, I have the time to investigate it properly. But to recap: How can you use the onthrow option and reproduce the bug?
Recap
We use a simple example program with throws and catches the exception Ex twice:
public class OnThrowAndJCmd {

    public static void main(String[] args) throws InterruptedException {
        System.out.println("Hello world!");
        try {
            throw new Ex("");
        } catch (Ex e) {
            System.out.println("Caught");
        }
        try {
            throw new Ex("");
        } catch (Ex e) {
            System.out.println("Caught");
        }
        for (int i = 0; i < 1000; i++) {
            System.out.print(i + " ");
            Thread.sleep(2000);
        }
    }
}

class Ex extends RuntimeException {
    public Ex(String msg) {
        super(msg);
    }
}
We then use one terminal to run the program with the JDWP agent attached and the other to run JDB:
java "-agentlib:jdwp=transport=dt_socket,server=y,suspend=y,address=*:5005,onthrow=Ex,launch=exit" src/test/java/OnThrowAndJCmd.java

# in another terminal
jdb -attach 5005
Then JDB prints us the expected error trace:
Exception in thread "event-handler" java.lang.NullPointerException: Cannot invoke "com.sun.jdi.ObjectReference.referenceType()" because the return value of "com.sun.jdi.event.ExceptionEvent.exception()" is null
        at jdk.jdi/com.sun.tools.example.debug.tty.TTY.exceptionEvent(TTY.java:171)
        at jdk.jdi/com.sun.tools.example.debug.tty.EventHandler.exceptionEvent(EventHandler.java:295)
        at jdk.jdi/com.sun.tools.example.debug.tty.EventHandler.handleEvent(EventHandler.java:133)
        at jdk.jdi/com.sun.tools.example.debug.tty.EventHandler.run(EventHandler.java:78)
        at java.base/java.lang.Thread.run(Thread.java:1583)
This might be, and I'm foreshadowing, the reason why IDEs like IntelliJ IDEA don't support attaching to a JDWP agent with onthrow enabled.
Remember that this issue might be fixed with your current JDK; the bug is reproducible with a JDK build older than the 10th of October.
Update: This bug does not appear in JDK 1.4, but in JDK 1.5 and ever since.
Looking for the culprit
In our preliminary investigation, Aleksey and I realized that JDB was probably not to blame. The problem is that the JDWP-agent sends an exception event after JDB is attached, related to the thrown Ex exception, but this event does not adhere to the specification. The JDWP specification tells us that every exception event contains the following:
| Type | Name | Description |
|---|---|---|
int | requestID | Request that generated event |
threadID | thread | Thread with exception |
location | location | Location of exception throw (or first non-native location after throw if thrown from a native method) |
tagged-objectID | exception | Thrown exception |
location | catchLocation | Location of catch, or 0 if not caught. An exception is considered to be caught if, at the point of the throw, the current location is dynamically enclosed in a try statement that handles the exception. [...] |
So clearly, none of the properties should be null in our case. Exception events are written in the writeExceptionEvent method of the JDWP agent. We can modify this method to print all accessed exception fields and check that the problem really is related to the agent.
For good measure, we also tell JDB to get notified of all other triggered Ex exceptions (> catch Ex), so we can obtain the printed information for the initial and the second exception:
Exception event:
    thread: 0x0
    clazz: 0x0
    method: 0x0
    location: 0
    object: 0x0
    catch_clazz: 0x0
    catch_method: 0x0
    catch_location: 0
Caught
Exception event:
    thread: 0x12b50fb02
    clazz: 0x12b50fb0a
    method: 0x12b188290
    location: 36
    object: 0x12b50fb12
    catch_clazz: 0x12b50fb1a
    catch_method: 0x12b188290
    catch_location: 37
This clearly shows that the exception that started the debugging session was not sent correctly.
How does onthrow work?
When the JDWP agent starts, it registers a JVMTI Exception event callback called cbEarlyException via SetEventCallBacks:
void JNICALL Exception(
  jvmtiEnv *jvmti_env,
  JNIEnv* jni_env,
  jthread thread,
  jmethodID method,
  jlocation location,
  jobject exception,
  jmethodID catch_method,
  jlocation catch_location)
Exception events are generated whenever an exception is first detected in a Java programming language method.
JVMTI Documentation
On every exception, this handler checks if the exception has the name passed to the onthrow option. If the exception matches, then the agent initializes the debugging session:

The only problem here is that cbEarlyException is passed all the exception information but doesn't pass it to the initialize method. This causes the JDWP-agent to send out an Exception event with all fields being null, as you saw in the previous section.
Fixing the bug
Now that we know exactly what went wrong, we can create an issue in the official JDK Bug System (JDK-8317920). Then, we can fix it by creating the event in the cbEarlyException handler itself and passing it to the new opt_info parameter of the initialize
static void JNICALL
cbEarlyException(jvmtiEnv *jvmti_env, JNIEnv *env,
        jthread thread, jmethodID method, jlocation location,
        jobject exception,
        jmethodID catch_method, jlocation catch_location)
{
    // ...
    EventInfo info;
    info.ei = EI_EXCEPTION;
    info.thread = thread;
    info.clazz = JNI_FUNC_PTR(env,GetObjectClass)(env, exception);
    info.method = method;
    info.location = location;
    info.object = exception;
    if (gdata->vthreadsSupported) {
        info.is_vthread = isVThread(thread);
    }
    info.u.exception.catch_clazz = getMethodClass(jvmti_env, catch_method);
    info.u.exception.catch_method = catch_method;
    info.u.exception.catch_location = catch_location;
    // ... // check if exception matches
    initialize(env, thread, EI_EXCEPTION, &info);
    // ...
}
The related Pull Request on GitHub is #16145. It will hopefully be merged soon. The last time someone reported and fixed an issue related to the onthrow option was in early 2002, so it is the first change in more than 20 years. The issue was about onthrow requiring the launch option to be present.
It works (even with your IDE)
With this fix in place, it works. JDB even selects the main thread as the current thread:
➜ jdb -attach 5005
Set uncaught java.lang.Throwable
Set deferred uncaught java.lang.Throwable
Initializing jdb ...
>
Exception occurred: Ex (to be caught at: OnThrowAndJCmd.main(), line=7 bci=18)"thread=main", OnThrowAndJCmd.main(), line=6 bci=17

main[1]
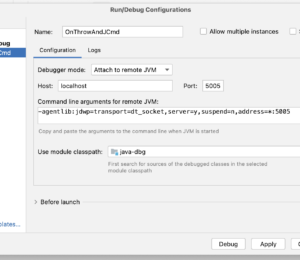
But does fixing this issue also mean that IDEs like IntelliJ IDEA now support attaching to agents with onthrow enabled? Yes, at least if we set a breakpoint somewhere after the first exception has been thrown (like with the onjcmd option):

Conclusion
Collaborating with other people from different companies in an Open-Source project is great. Aleksey found the bug interesting enough to spend half an hour looking into it with me, which persuaded me to look into it again after returning from Devoxx. Fixing these bugs allows users to fully use on-demand debugging, speeding up their error-finding sessions.
I hope you liked this walk down the rabbit hole. See you next week with another article on debugging or my trip to Devoxx trip (or both). Feel free to ask any questions or to suggest new article ideas.
I'll be giving a few talks on debugging this autumn; you can find specifics on my Talks page. I'm happy to speak on your meet-up or user group; just let me know.
This article is part of my work in the SapMachine team at SAP, making profiling and debugging easier for everyone. It first appeared on my personal blog mostlynerdless.de.
- October 26, 2023
- 5 min read




Comments (0)
No comments yet. Be the first.